Product · Rail simulation suite
Hi-SimuX
Hi-SimuX lets you model and simulate a rail system in great detail and flexibility, to verify and optimize its design and operation. Development continues in line with the needs of the industry.
- What
- A rail simulation suite combining traction power, operation and energy efficiency simulation in one package.
- For whom
- Operators, transport authorities, railways, planning and design firms, main contractors, E&M subsystem suppliers.
- How
- Line, vehicle, operation and power supply data are modelled in a graphical interface; train movement and load flow are solved together at every time step.
- Interface
- C# (.NET); text or XML data import; data exchange with MATLAB™ and Mathematica™.
- In use
- In HI-SIM projects since 2020
Applications
Simulation is essential for testing and optimizing planned systems. When operating conditions are about to change significantly (shorter headways, new vehicles replacing old ones, added stations), simulation shows the effect of the change on the existing system in advance.
- Headway analysis and train performance calculations
- Single-track operation optimization
- Performance assessment of rolling stock under different operating conditions
- Rolling stock traction package sizing and optimization
- Traction system equipment sizing or adequacy verification
- Catenary / third-rail capacity determination or adequacy verification
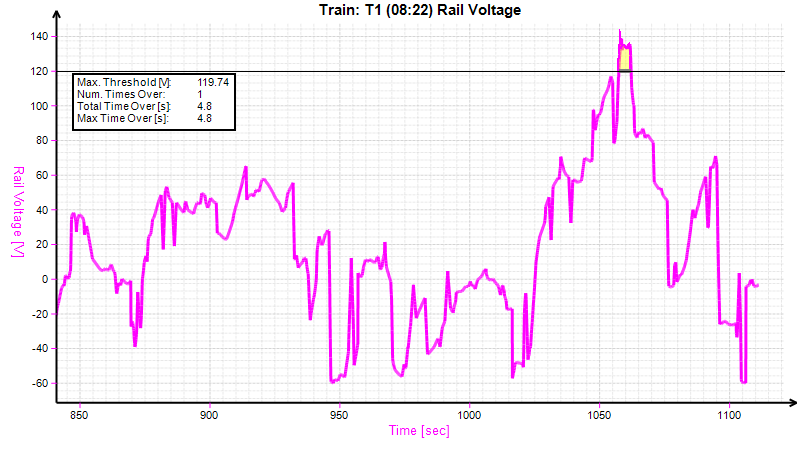
- Minimum, maximum and mean useful voltage values on trains and in zones
- Regenerative braking energy usage
- Rail potential and stray current calculations
- DC-side short-circuit current calculations
- Comparison of different feeding schemes
- Energy consumption and loss calculations
- Development and assessment of energy-efficient driving strategies
Main features
A satisfactory simulation needs hundreds of parameters from the user. The main inputs are:
- Number, names and lengths of lines, stations and dwell times
- Curves, gradients, speed limits and maximum operating speed
- Depots
- Train types on the line: start and end positions, stations, number of cars, headway
- Number, names and positions of substations, section insulators, catenary and rail data
- Vehicle length, weight, traction power, maximum acceleration and deceleration
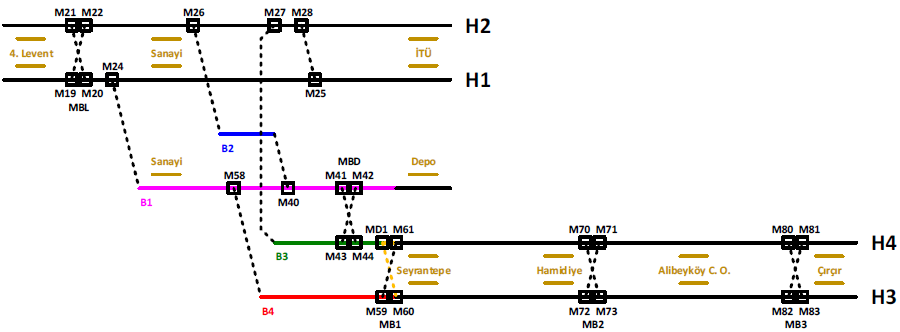
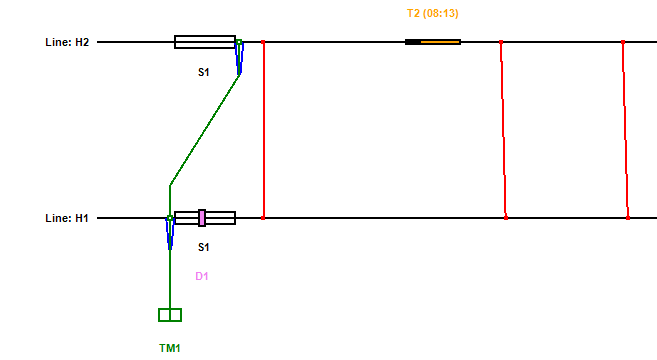
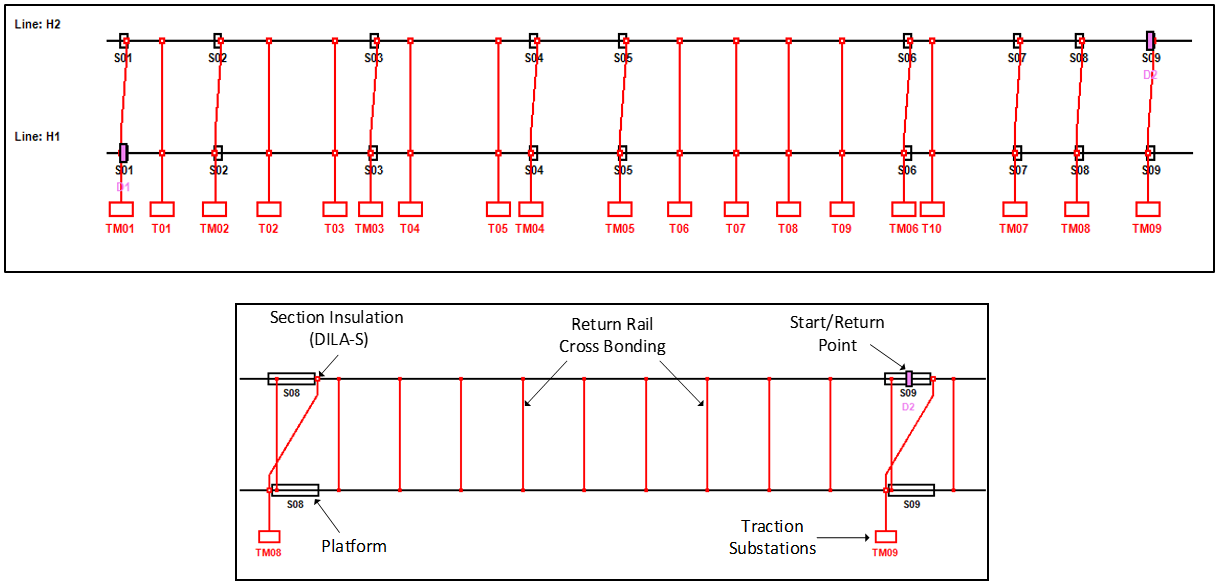
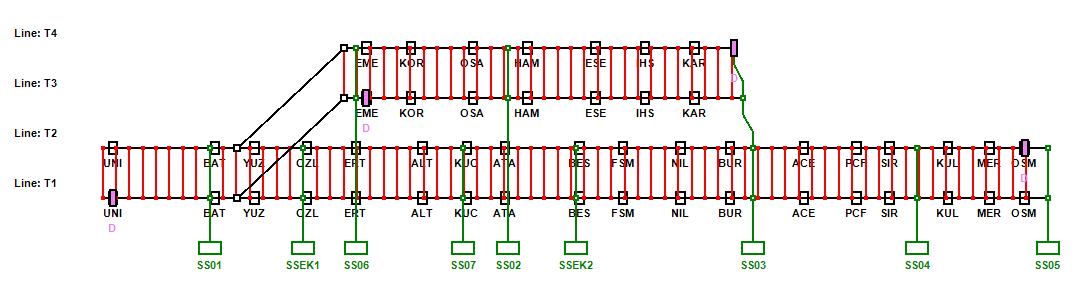
All system parameters and objects are entered through an extremely user-friendly graphical interface and shown on a horizontally scaled line representation. Many train types and compositions can share one model; train positions update dynamically and any parameter can be followed over time while the simulation runs. Users can also create fault conditions during the run; every item on the representation is dynamic and works with left and right mouse clicks.
Hi-SimuX’s user interfaces are built in C# (.NET). Inputs are entered in dialog windows, and data can also be imported from Notepad or Excel as plain text or XML. Data exchange with scientific programs such as MATLAB™ and Mathematica™ is possible.
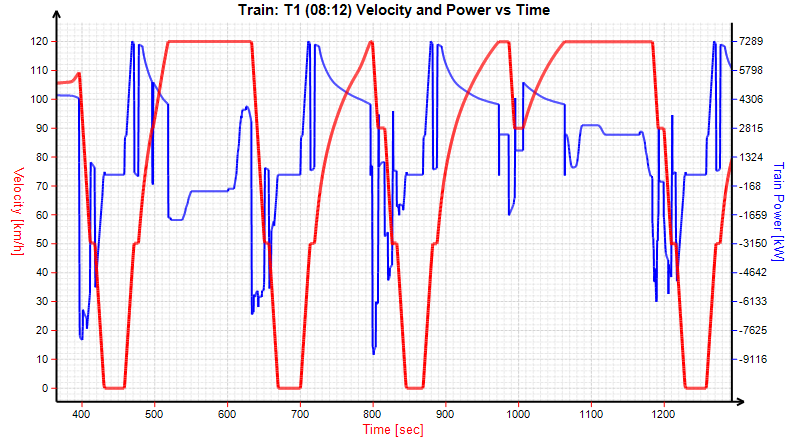
Unlike many simulation tools, Hi-SimuX solves train performance and electrical load flow together at every step. When the voltage drops, tractive effort and acceleration fall and so does the power the train draws, which keeps the voltage sag from getting worse. This is how the achievable headway is found even in worst cases such as two neighbouring substations out of service.
Optimum traction power supply design
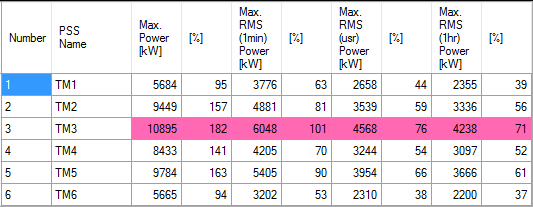
For the most cost-effective traction power design of new lines and extensions, Hi-SimuX analyses normal, failed-substation and emergency operation in detail. Outputs depend on the project and include instantaneous and RMS power and current drawn from substations and feeders over different time windows. Other outputs that support the design:
- Train voltage levels
- Feeder instantaneous and RMS currents
- Running rail voltage rise (“touch potential”) with respect to ground, and stray currents
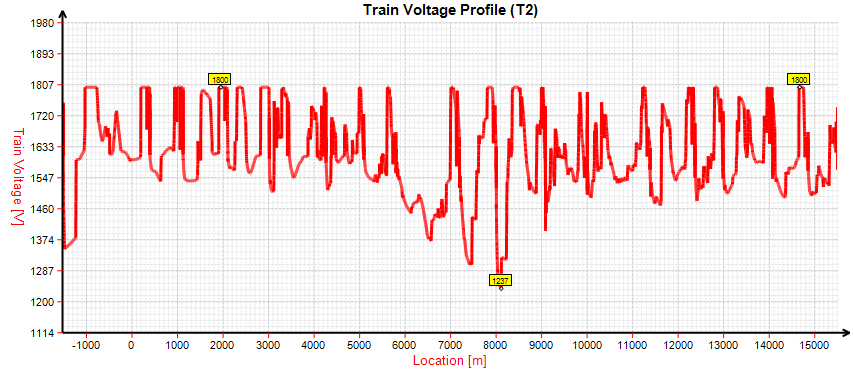
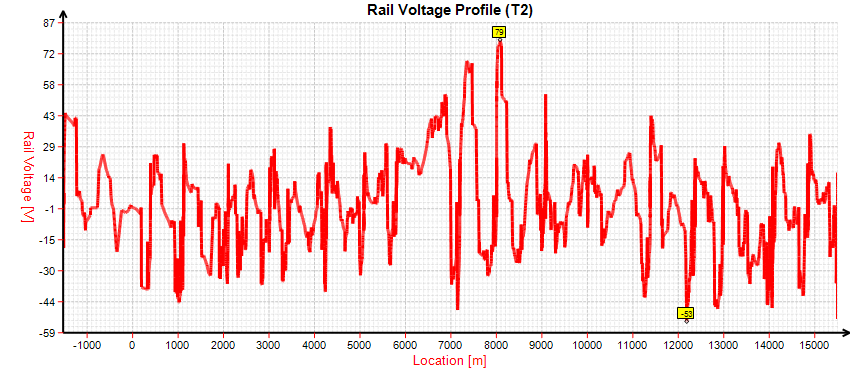
Traction power systems designed and built long ago may need upgrading, but what is the most cost-effective investment plan? Hi-SimuX determines whether existing substations, OCS / third rail and power cables are adequate, or which enhancements are needed as service increases and new vehicles arrive. A thorough analysis reveals the strengths and weaknesses of the system for an integrated, updated design.
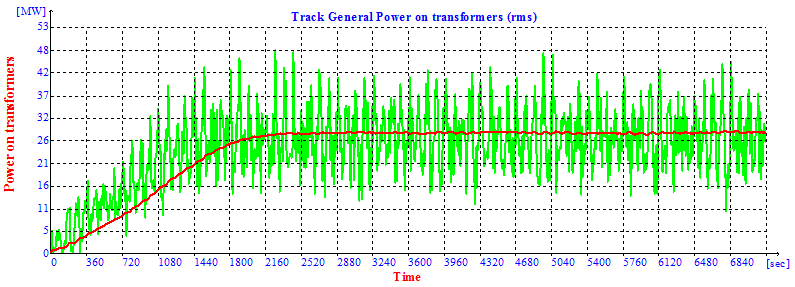
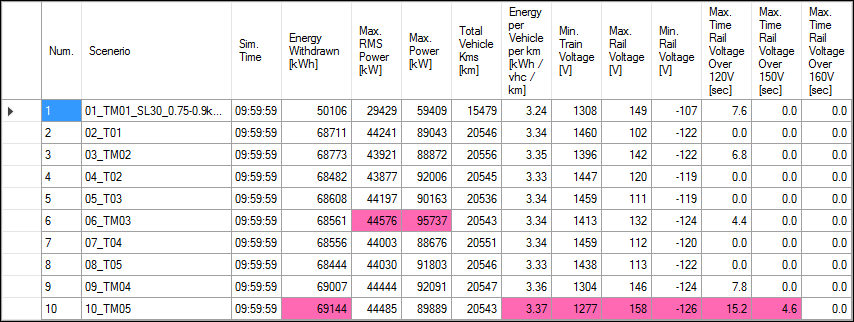
Hi-SimuX supports rapid investigation of solutions to traction power issues: adding a substation, adding paralleling cables or feeder wires to the catenary, changing substation no-load voltages, upgrading the running rails, third rail / catenary or negative return, or even altering the schedule (headway, train length, speed limits).
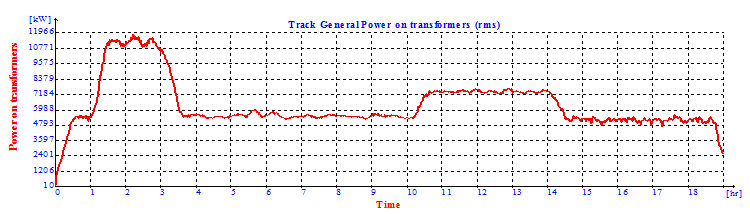
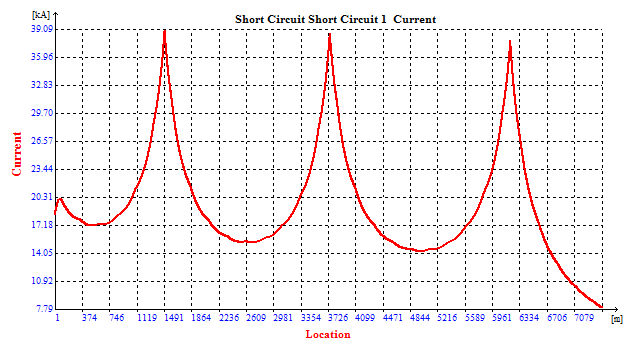
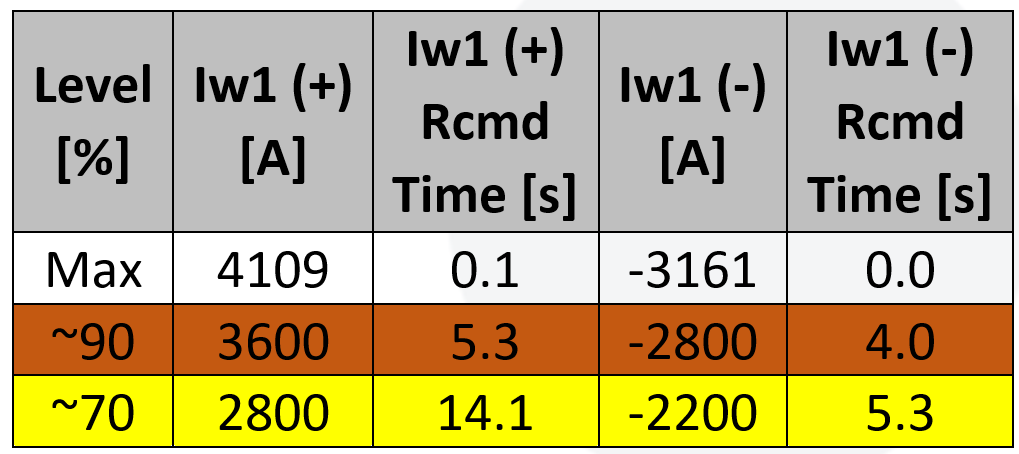
Protection settings of circuit breakers are essential for safe operation. Hi-SimuX models short circuits on the line and determines close and remote short-circuit currents, which guides the magnetic trip setting. It also helps to set relays for inverse-time over-current protection. The table below gives suggested two-stage over-current settings and durations for a line feeder breaker in both normal and reverse directions.
Rolling stock procurement
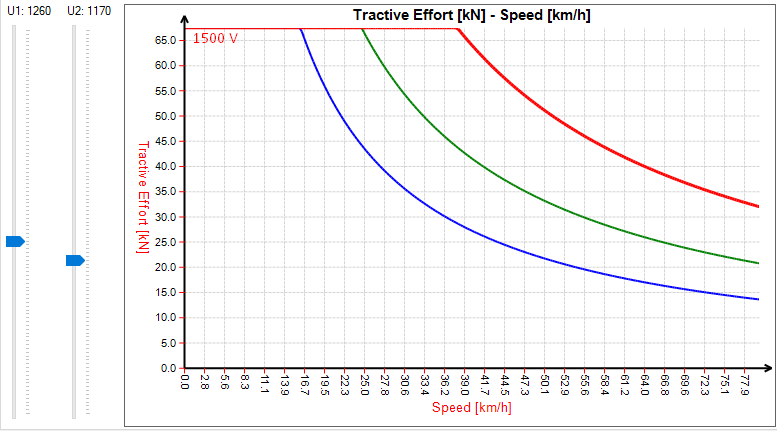
There is a trade-off between train weight and power: where is the optimum? Can the rolling stock meet the planned trip time? What happens if another vehicle is added to the train? Hi-SimuX’s vehicle library and the flexibility to create and edit vehicle models support these analyses.
Performance under worst or weakened conditions
With detailed models of rail system components and fast algorithms, Hi-SimuX determines whether a train has the power ratio to climb a grade and keep the advertised trip time, for example when the substation on a steep gradient has failed.
Regenerative braking energy recuperation
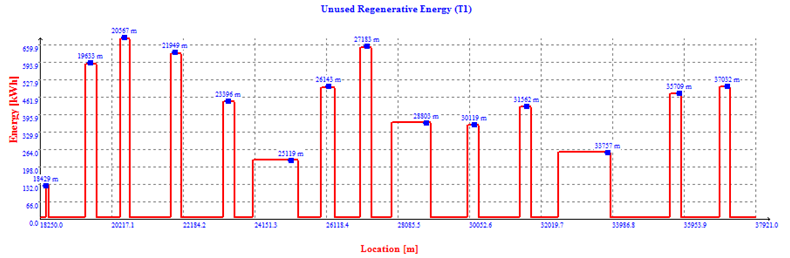
Regenerative braking is standard today, and alternative technologies are being studied to use the surplus energy produced while braking. How can the traction power system and vehicle characteristics be optimized so that more of the regenerated energy is used? Hi-SimuX’s algorithms support the optimization process to cut the carbon footprint of electric railway networks and improve energy recovery.
Optimizing alignments and layouts
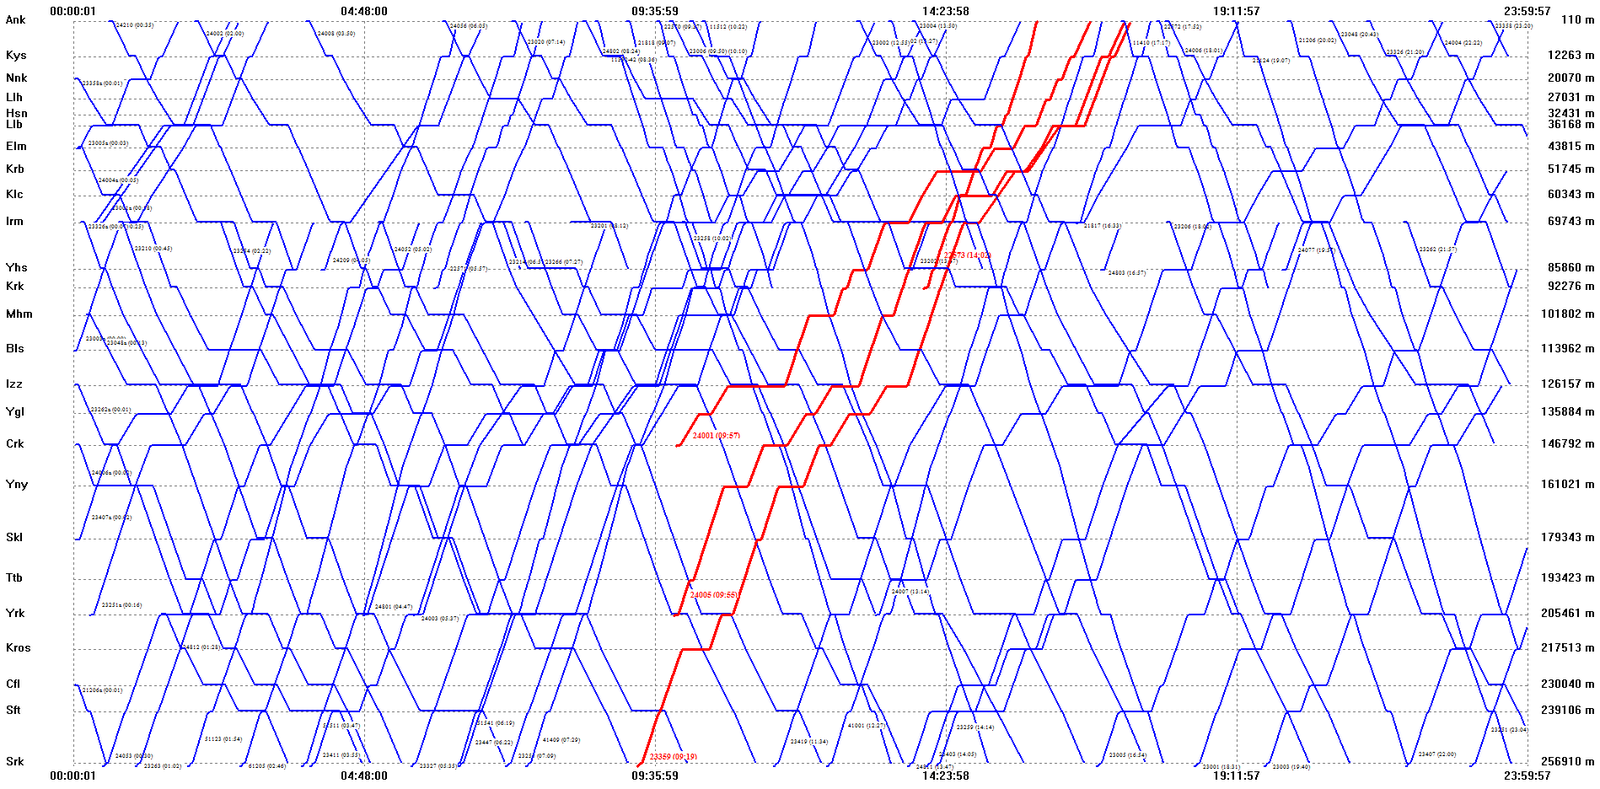
For new systems and extensions, planning can produce an overwhelming number of alignment alternatives. Which one gives the best balance between trip time and energy-efficient operation? Hi-SimuX’s rapid modelling, including importing alignment data from external sources, allows fast turnaround in simulating all of the alternatives.
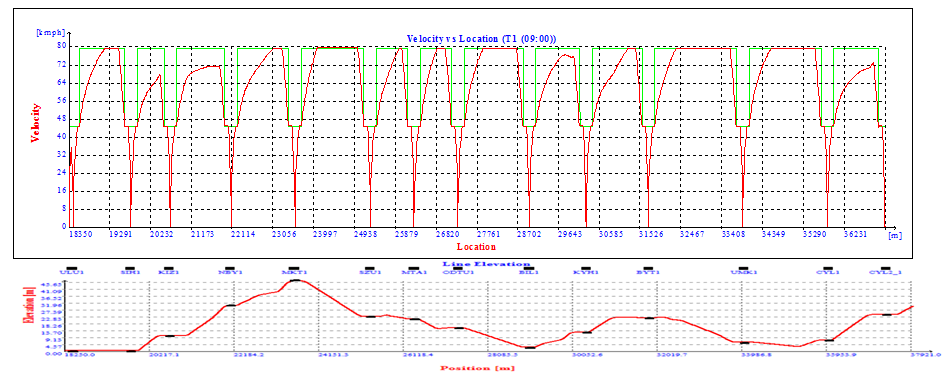
Energy efficiency strategies: eco-driving and other methods
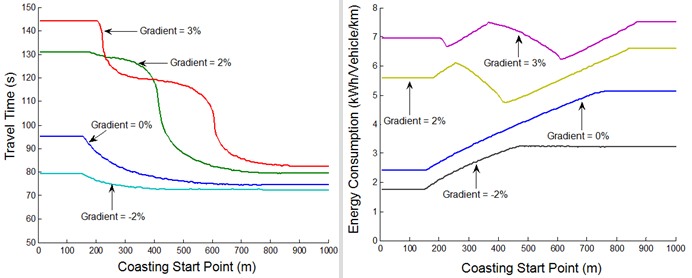
The demand for greener operation drives the search for algorithms that save the most energy. Hi-SimuX models many strategies and assesses their fitness for a given system. It calculates energy consumption and travel time for different coasting start points, and can be plugged into artificial neural networks and genetic algorithms for very detailed optimization problems.
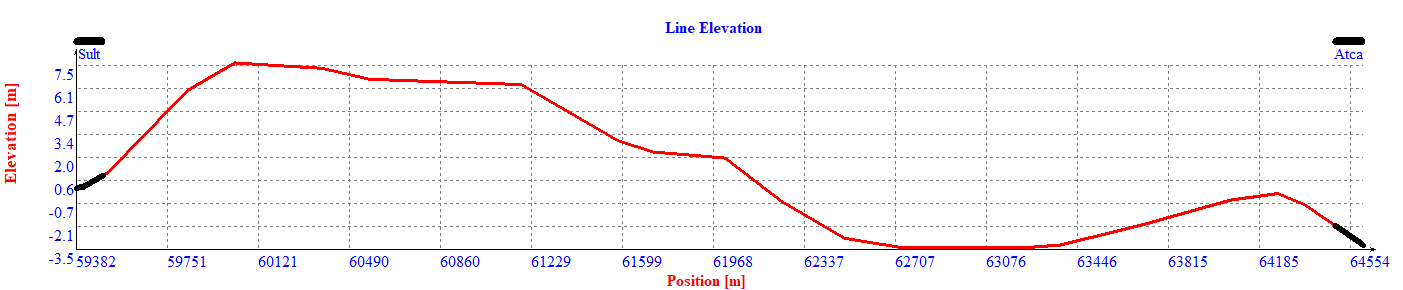
Example: a DMU set on a 5.2 km line section
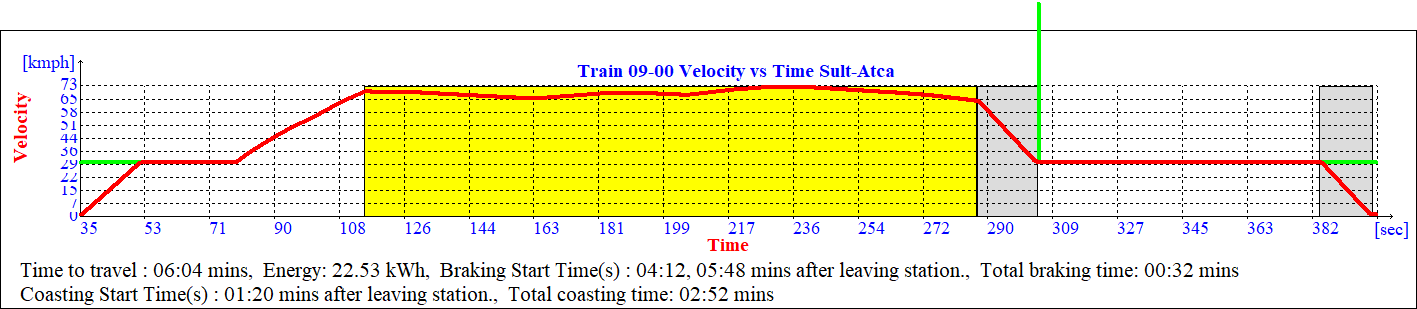
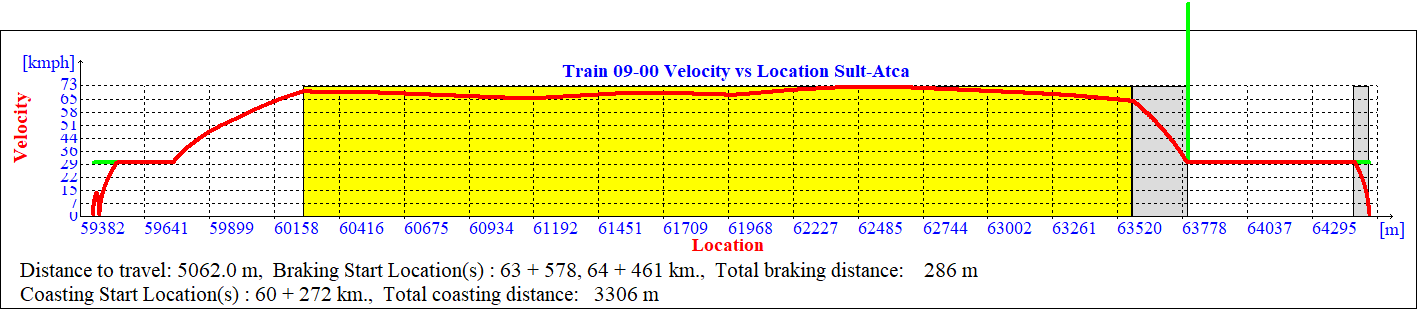
The first graph shows the vertical alignment; the next two show all-out velocity profiles against time and location. Then comes an eco-driving scenario where coasting starts at km 60+272.


- All-out · time
- 05:10
- All-out · energy
- 53.84kWh
- Timetable
- 6min
- Eco-driving · time
- 06:04
- Eco-driving · energy
- 22.53kWh
- Coasting time
- 02:52
Values are published Hi-SimuX simulation results. For a longer example (14.5 km), see Energy optimization.
Train operation and performance analysis
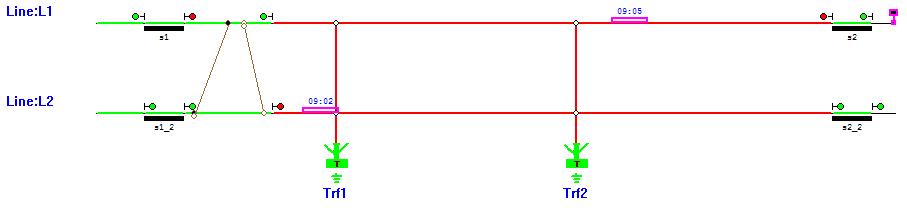
Independently of the traction power system, detailed modelling of line, train and signalling characteristics allows a more realistic study of end-of-line turnbacks, of how operation is affected in emergencies, and of the effect of possible system changes on signalling.
FAQ
How do Hi-SimuX and SimuX relate?
SimuX is integrated rail system simulation software developed at Istanbul Technical University; its first version dates from 2003. Hi-SimuX is the rail simulation suite HI-SIM has used in its projects since 2020. Both solve train performance and electrical load flow together at every step.
What data does Hi-SimuX need?
Line data (lines, stations, dwell times, curves, gradients, speed limits), depots, operation data (train types, cars, headway), the power supply (substations, insulators, catenary and rails) and vehicle data (length, weight, traction power, accelerations). Data is entered in dialogs or imported as text or XML.
Can faults be created during a simulation?
Yes. Users can create fault conditions while the simulation runs; cases such as a substation out of service are studied alongside normal and emergency operation.
Can short circuits and protection settings be calculated?
Yes. Hi-SimuX analyses the steady state of DC-side short circuits, computes close and remote short-circuit currents and produces tables that help set the circuit breakers.
Do you need simulations for your project?
Write to us about your traction power, headway, train movement or energy efficiency studies, and we will scope your project needs together.
info@hisim.com.tr