Service · Energy optimization
Energy optimization
Demand for greener operation drives the search for algorithms that save the most energy. Hi-SimuX models energy saving strategies with the actual data of the planned line and shows their effects and possible savings before they are applied.
- All-out driving
- 175.87kWh
- T 11:36
- Eco-driving
- 69.17kWh
- T 14:24
- Energy difference
- −60.1%
- Tmax 15:00
Energy efficiency: eco-driving and coasting
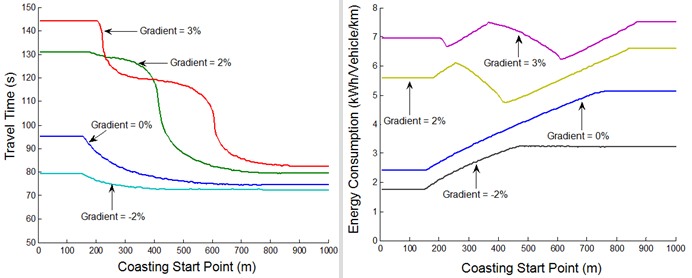
Hi-SimuX calculates energy consumption and travel time against different coasting start points and helps operators find the optimum coasting points for a given travel time. It can be plugged into artificial neural networks and genetic algorithms for very detailed optimization problems. Thanks to the software’s flexibility, the length and complexity of the line are not a problem.
Example: a DMU set on a 14.5 km line section
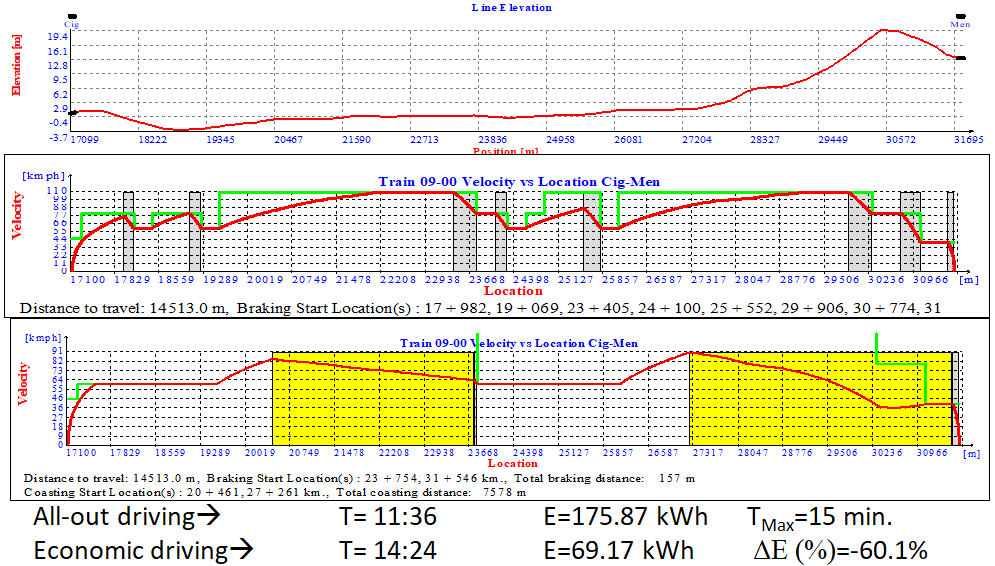
The first graph shows the vertical alignment of the section, the second the all-out velocity profile, and the last the velocity profile with unnecessary acceleration prevented and the coasting strategy applied. Yellow areas are coasting zones.
- Distance
- 14,513m
- All-out · time / energy
- 11:36 · 175.87 kWh
- Eco-driving · time / energy
- 14:24 · 69.17 kWh
- Energy difference
- −60.1%
- Maximum allowed time
- 15min
- Total coasting distance
- 7,578m
Coasting starts at km 20+461 and km 27+261. Values are published Hi-SimuX simulation results; savings are calculated separately for each line, vehicle and timetable.
Alignment optimization
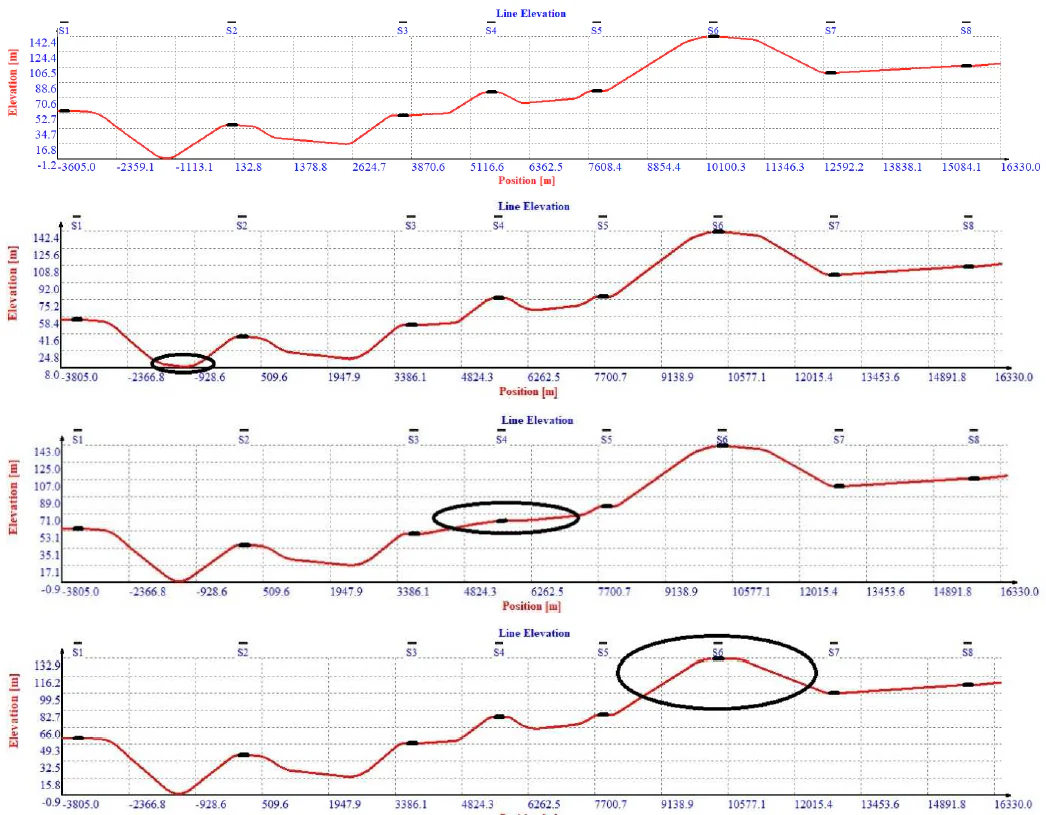
New lines and extensions can produce many alternative route plans. Which route gives the best balance between energy consumption and travel time? Hi-SimuX’s ability to model alignment data in different formats flexibly and quickly makes it possible to evaluate many alternatives in a short time.
Regenerative braking energy recuperation
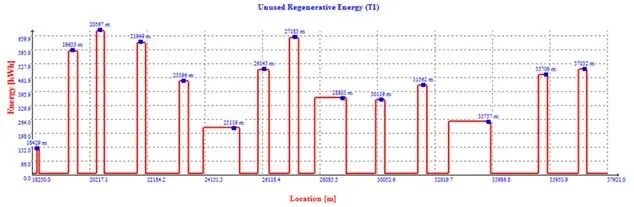
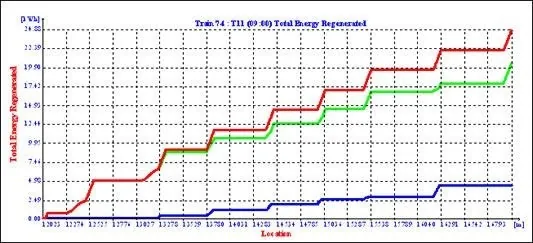
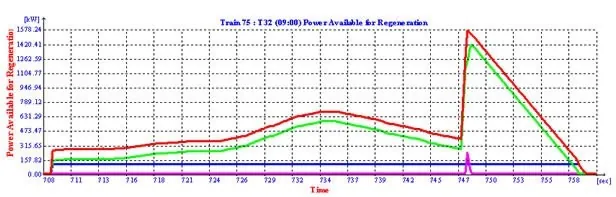
Regenerative braking is standard practice today. Most of the energy regenerated by braking trains is used by other trains on the line and the rest is burnt in the braking resistors. Calculating the burnt energy correctly is essential for evaluating the cost of additional systems (inverters or energy storage) that would recover it.
How can the traction power system and the vehicles be optimized so that more of the regenerated energy is used? Hi-SimuX’s advanced algorithms make it possible. The graphs below show the unused energy burnt along the line, a train’s regenerated energy with its used and burnt parts, and, for a train descending at the speed limit, the regenerated power used by its own auxiliaries, by other trains via the catenary, and burnt.
From simulation to operation: eco-driving
The coasting strategy found in simulation reaches daily operation through two products.
FAQ
What is coasting?
Coasting means cutting traction and letting the train run on its momentum. By avoiding unnecessary acceleration it reduces energy consumption. Hi-SimuX calculates how different coasting start points affect travel time and energy, and helps find the best points for a given time.
How much energy can eco-driving save?
It depends on the line, the vehicle and the timetable, and is calculated for each line. In a published Hi-SimuX example, a DMU set on a 14.5 km section used 69.17 kWh instead of 175.87 kWh (60.1% less); the time went from 11:36 to 14:24, within the 15-minute limit.
How much does the alignment affect energy use?
It depends on the project. In a published example, the lowest and highest energy consumption of four alternative vertical profiles differed by 2.7%.
Do you need simulations for your project?
Write to us about your traction power, headway, train movement or energy efficiency studies, and we will scope your project needs together.
info@hisim.com.tr