Product · Eco-driving and train simulation platform
Hi-SimTrain
Hi-SimTrain is a web-based application for energy-efficient driving, simulation and eco-driving analysis using railway track and train data. It also has a Windows desktop edition, and it is the server side of the HISIMDAS driver advisory app.
Optimisation a separate example line · Station 1 → Station 4
Energy difference−27 %vs all-out · time +5.5%
Representative example simulation; not real operating data.
- What
- A web application for energy-efficient driving, train simulation and eco-driving analysis from track and train data.
- For whom
- Railway operators: organisational use with user, organisation manager and super admin roles.
- How
- Track and train are modelled; the least-energy driving within a target time is found with coasting and eco speed limits.
- Platform
- Web (hisimtrain.com) and Windows desktop; Turkish and English UI
How it works
Hi-SimTrain is a train performance and eco-driving platform for railway operators and engineers. It keeps line and train data in one place, simulates running time and energy consumption, finds coasting strategies that cut energy without missing the timetable, sends those strategies to the HISIMDAS app in the driver's cab as advisory profiles, and turns the trip data coming back from the field into measurable reports. The web application, the Windows desktop application and the mobile app all work on the same central data.
- 1DataLine geometry, gradients, curves, speed limits, stations and train characteristics are entered, or generated from map data with the Track Builder.
- 2Simulation and optimisationA physics-based engine calculates running time and energy; the optimiser finds the coasting windows and eco speed limits that use the least energy within the time budget.
- 3Advice in the cab (HISIMDAS)For each station-to-station leg the app receives an advisory profile from the server and shows the driver when to apply traction, when to coast and when to brake.
- 4Trip data comes backThe trip's position, speed and motion records are uploaded to the server; managers can follow active trips on a live map.
- 5ReportsEvery trip is compared with the advice, scored and summarised by line, driver and fleet. Station positions captured in the field can be written back to the line data after approval.
Capabilities
01Line data and Track BuilderAccurate simulation starts with accurate line data. Hi-SimTrain keeps line data in editable tables, generates new lines from map data and improves station positions with measurements from the field.
- Line data tables: Speed limits, gradients, curves, tunnels, stations (start, stopping point, end, dwell time), coasting and eco speed limit tables are edited on screen; rows can be copied and pasted, and the reverse-direction data can be generated in one step.
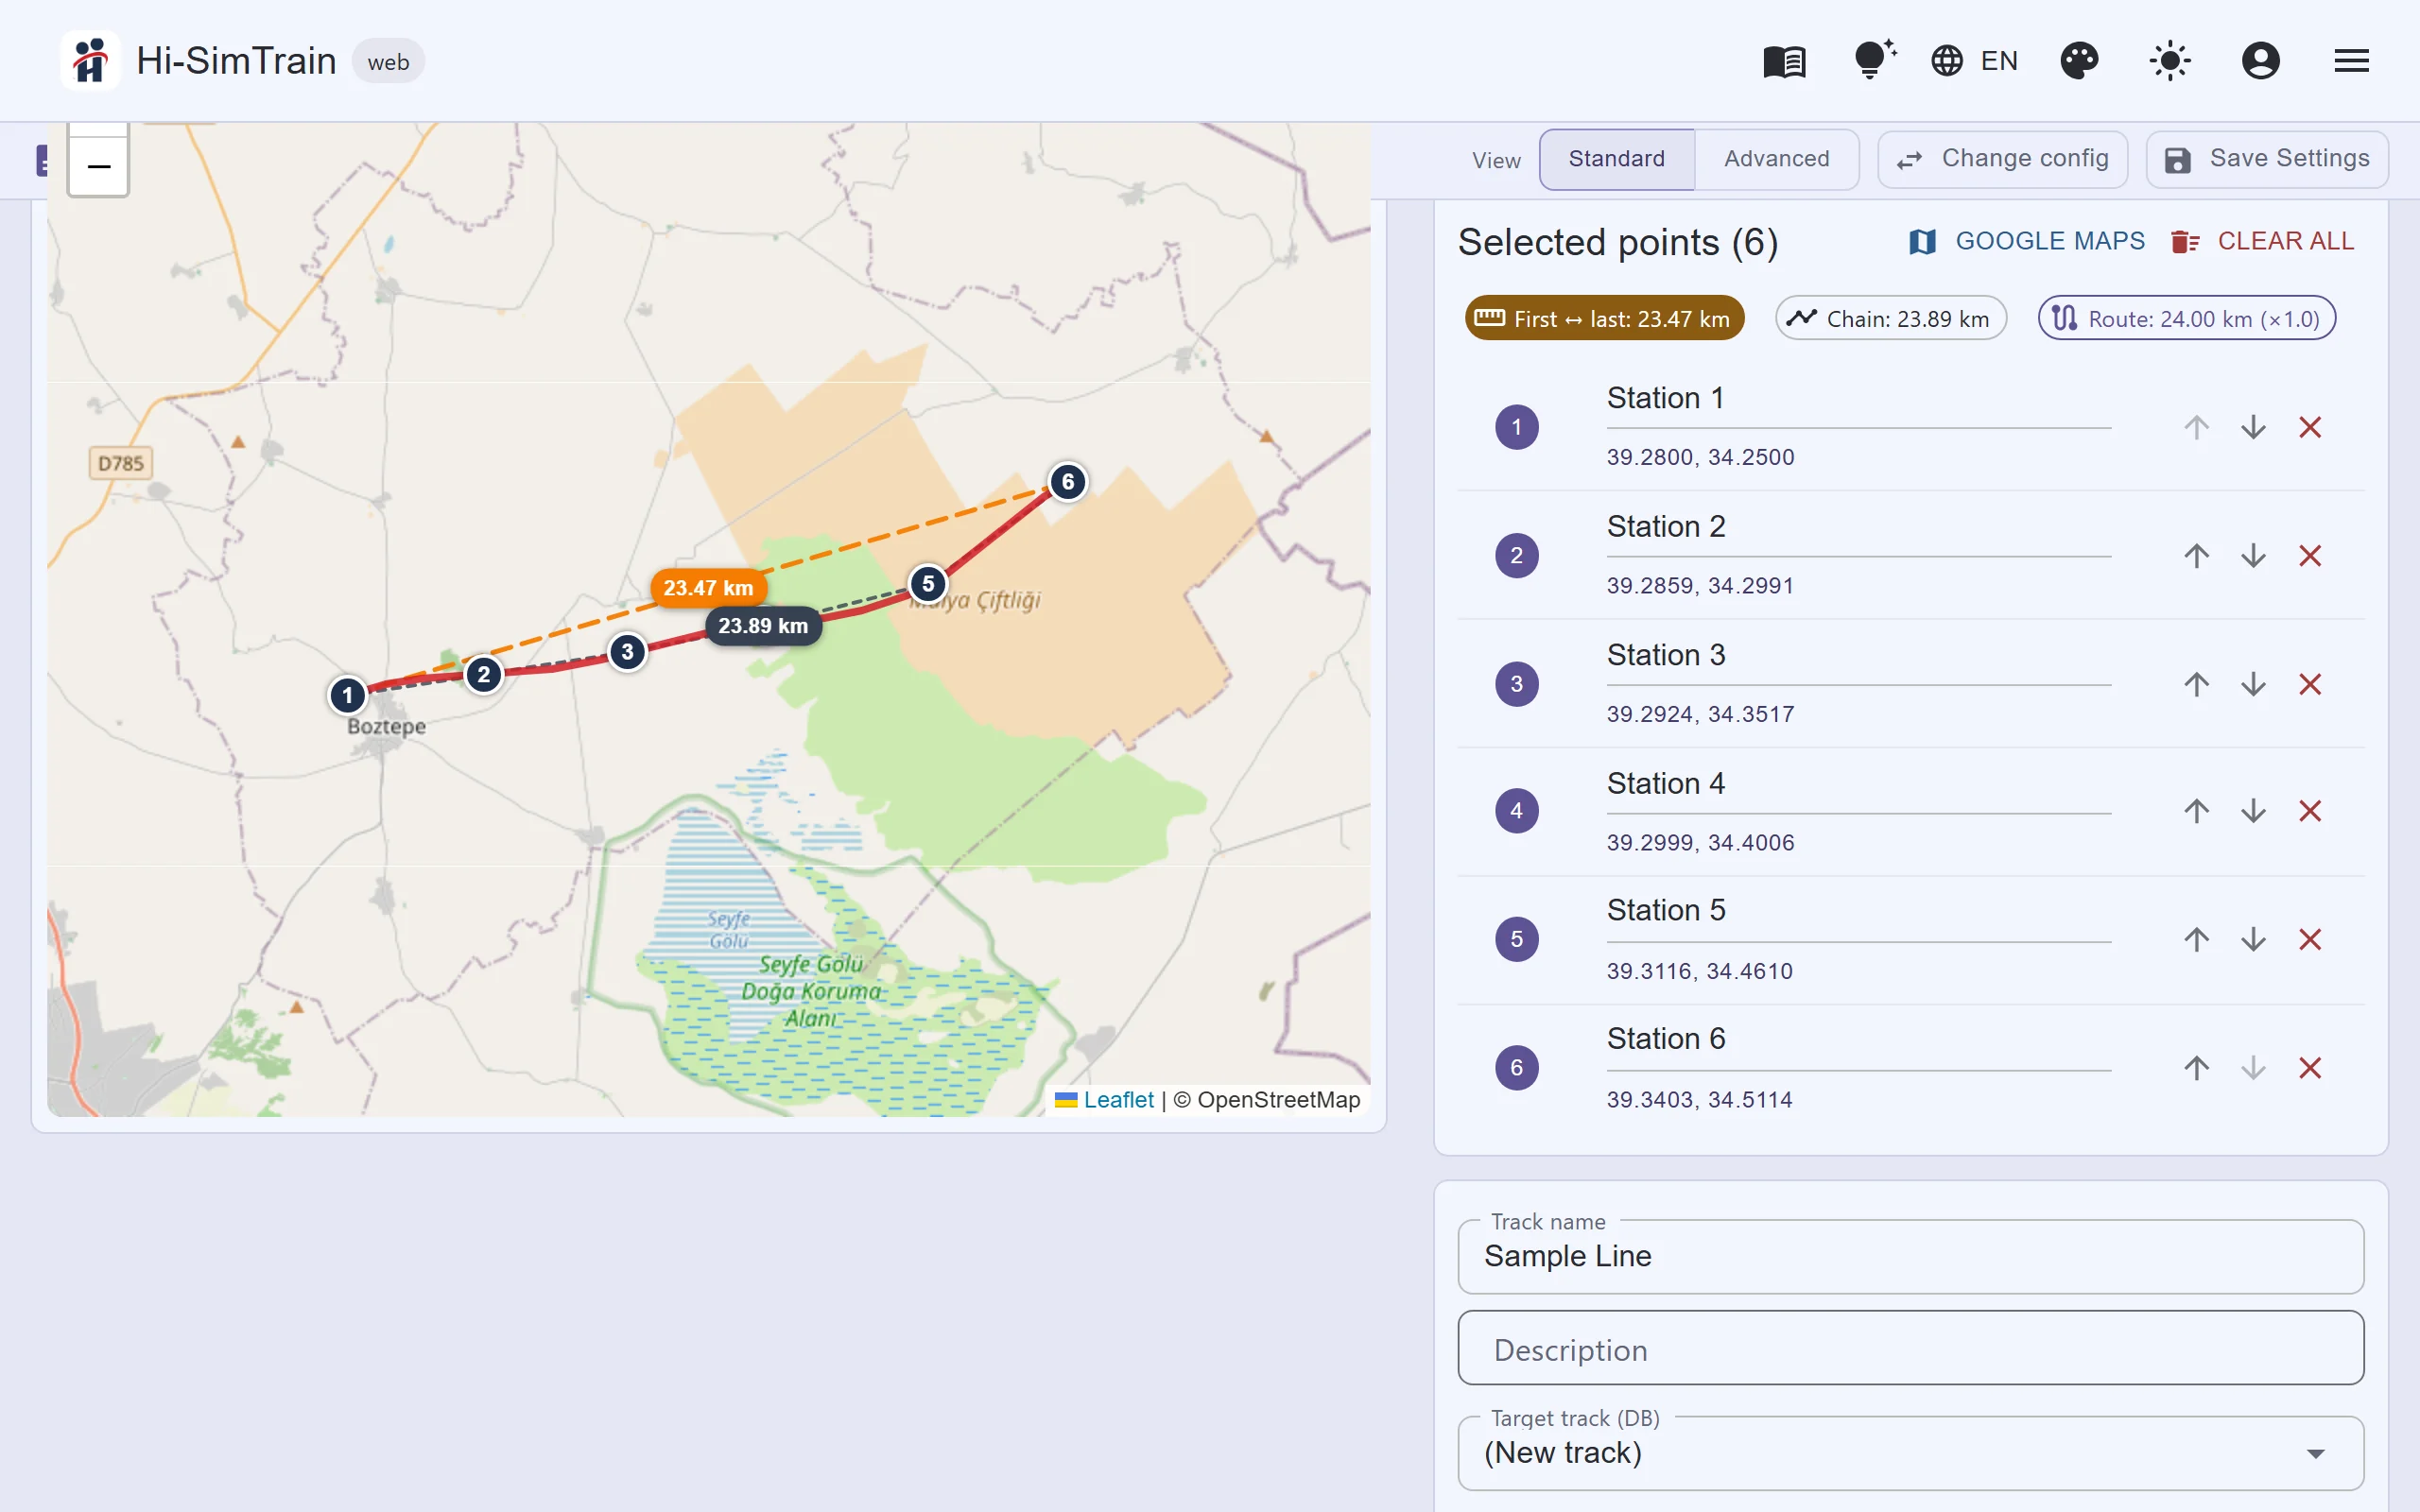
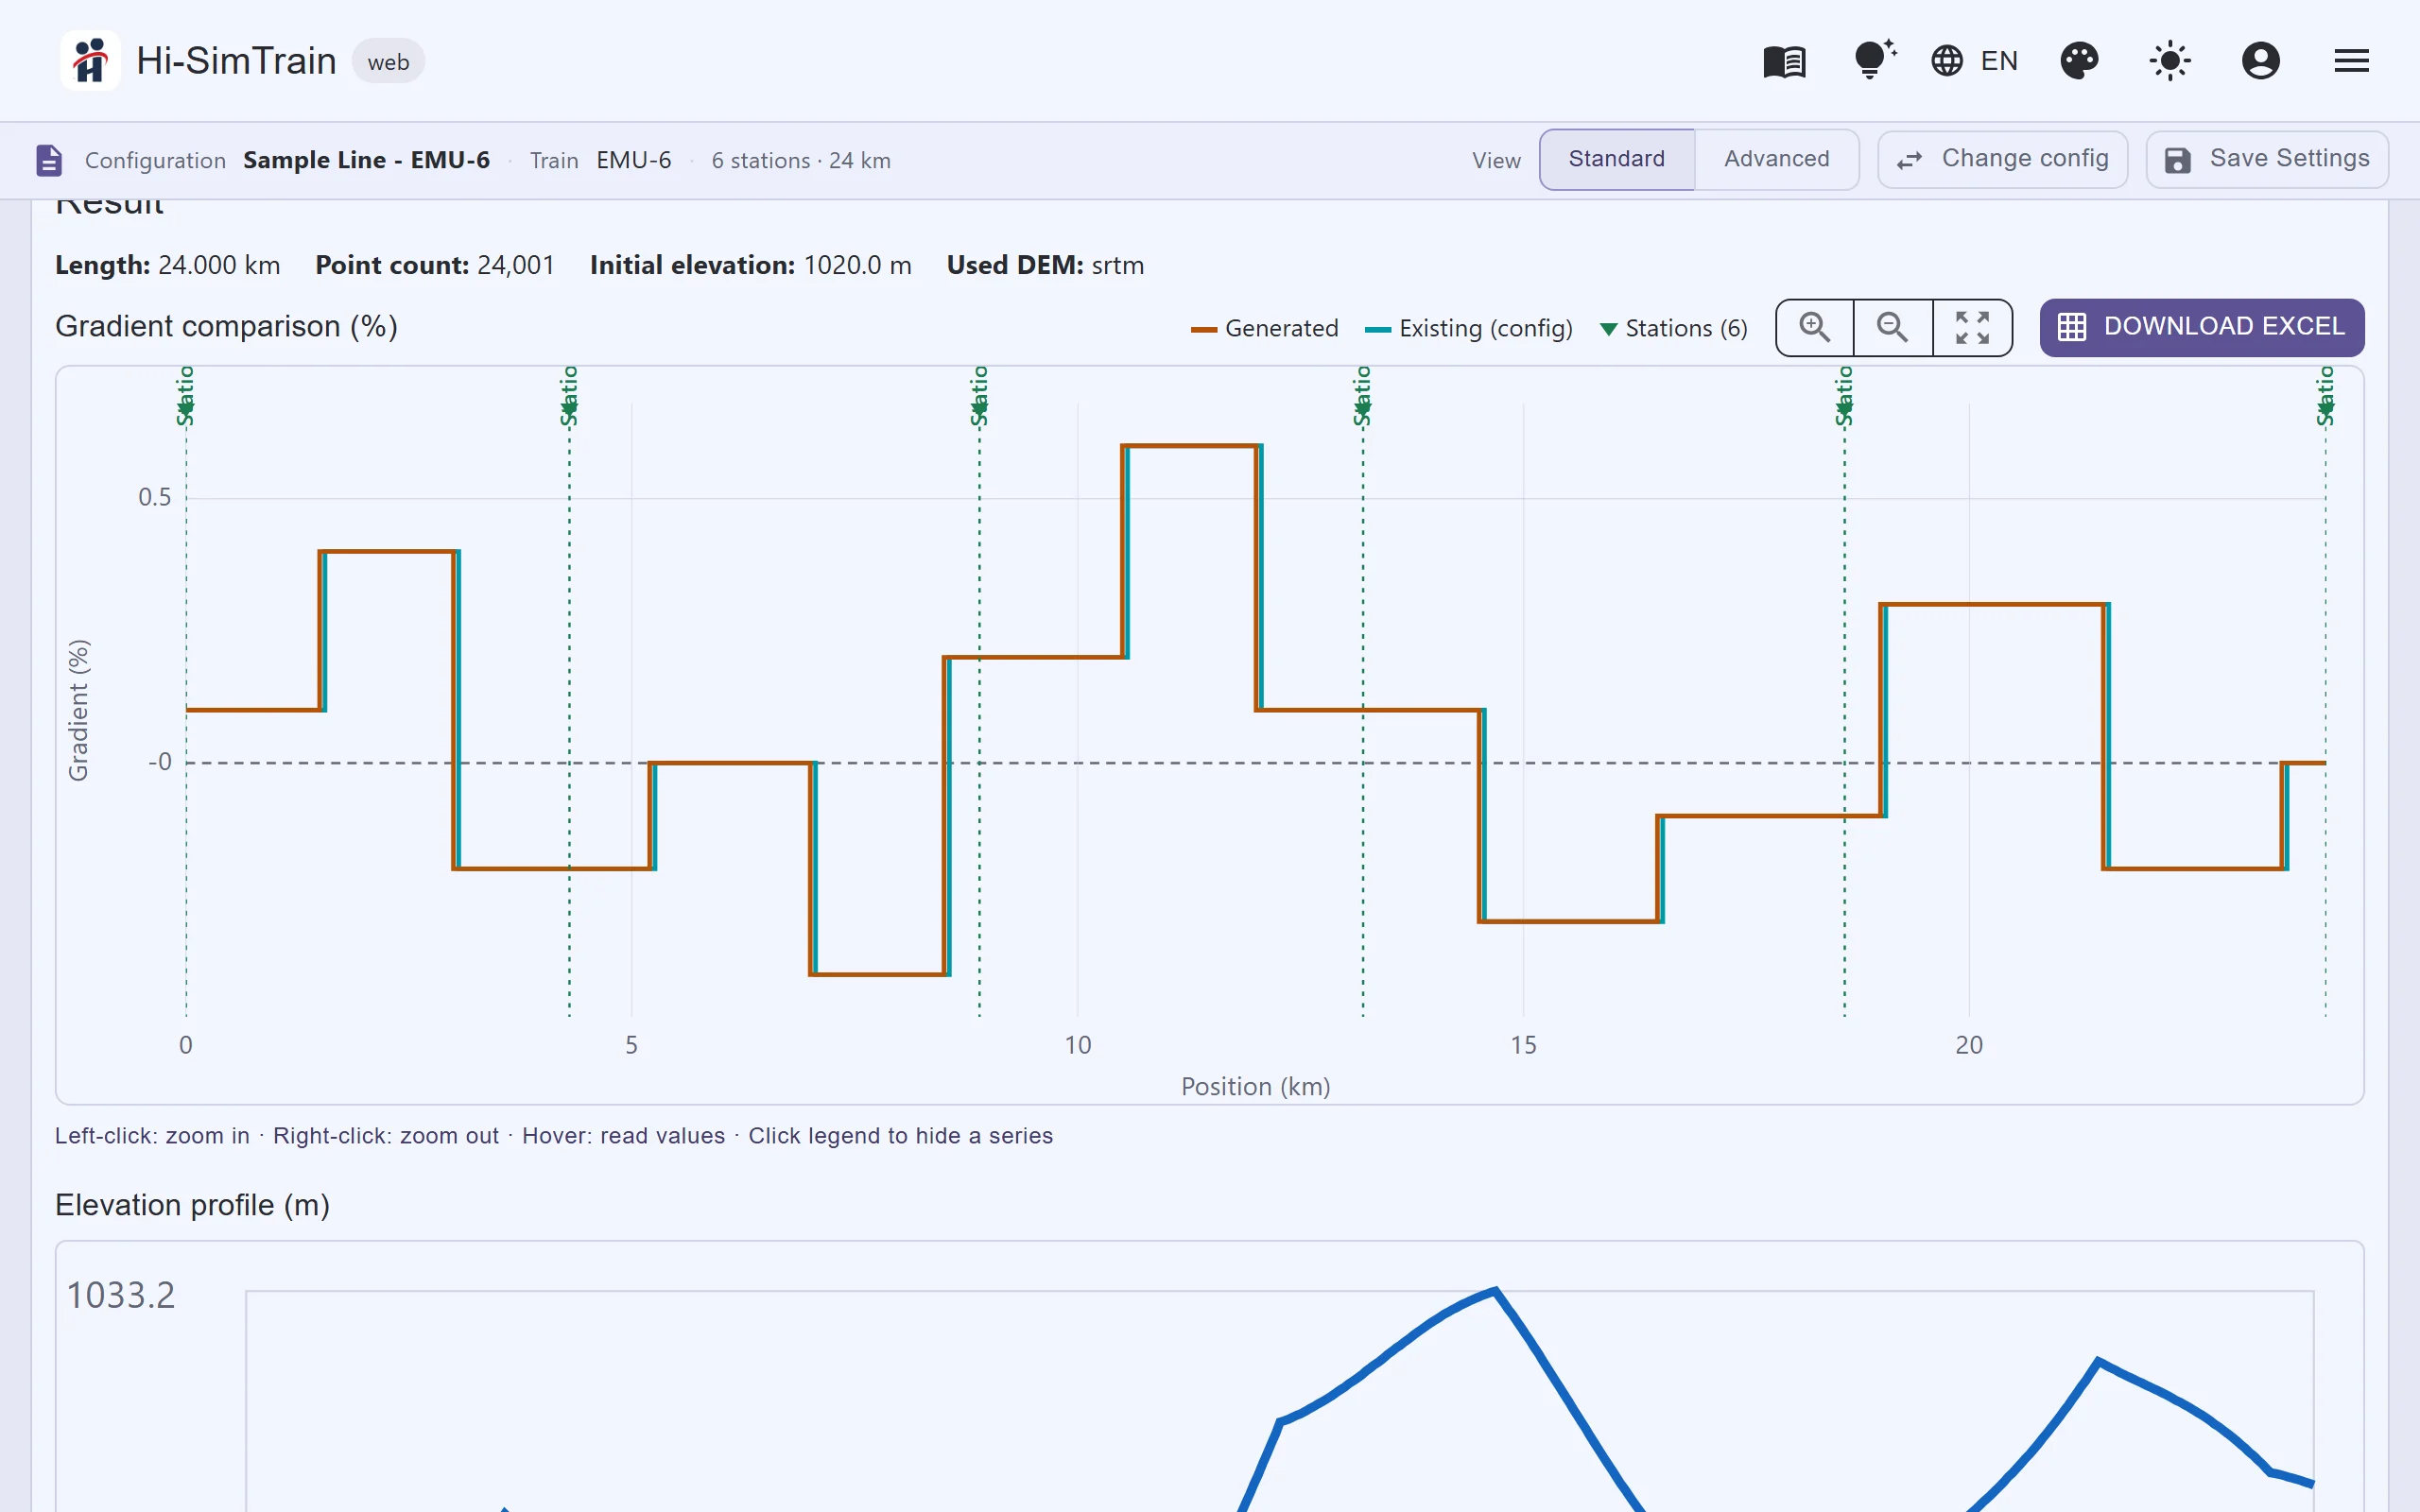
- Track Builder: Stations and waypoints are picked on a map; a route is traced on the rail network data, a position track with one-metre spacing is created, elevation is taken from a digital elevation model and a smoothed gradient table is produced. Curves, speed limits, tunnels and bridges, and stations can be derived as well.
- Working with existing lines: The generated gradient is compared with the existing line data on one chart and the comparison can be exported to Excel; an existing line can be extended with a new section, or only its position track can be updated while all other data is kept.
- Elevation source comparison: Several elevation sources are compared on the same route (maximum gradient, error size) so the most suitable one can be chosen.
- Station positions from the field: Station points captured by drivers in the app are collected and averaged with outliers excluded; selected positions are written to the line data after approval, an approved station is locked, and every change is kept in a history and can be reverted.
- Data checks: Line geometry is checked before it is saved; the consistency check scans the whole configuration under general, line, train, movement and braking headings and produces a report.
02Train and vehicle dataThe train model is the second foundation of energy and time results. Vehicle characteristics, traction and braking behaviour, and driving strategies are kept on separate screens.
- Train parameters: Mass (locomotive and consist), length, maximum speed, maximum acceleration and deceleration, rotating mass share, resistance coefficients and efficiency values.
- Tractive effort and braking curves: Speed-dependent tractive and braking force tables; optional entry as an acceleration table instead of forces; a tractive effort curve can be generated from a chosen number of points.
- Safe braking: ERTMS braking models and national values, and CBTC braking parameters; low-adhesion and brake inhibition zones.
- Driving strategies: All-out, coasting (eco) and user-defined strategies, with coasting and re-motoring speeds per strategy.
- Locomotive and drawbar calculations with their own parameter set.
- Bulk distribution: A train definition can be added to, or updated in, many library configurations in one operation.
03Running-time and energy simulationThe simulation engine moves the train step by step between two selected stations and calculates time and energy. The same engine serves the web, the desktop and the in-cab advice, so results agree everywhere.
- Single run: Choose start and end stations, either direction, entry and exit speeds and the driving strategy.
- Results: Running time, traction energy, regenerative energy, total energy, maximum resistance and opposing force; energy efficiency between stations.
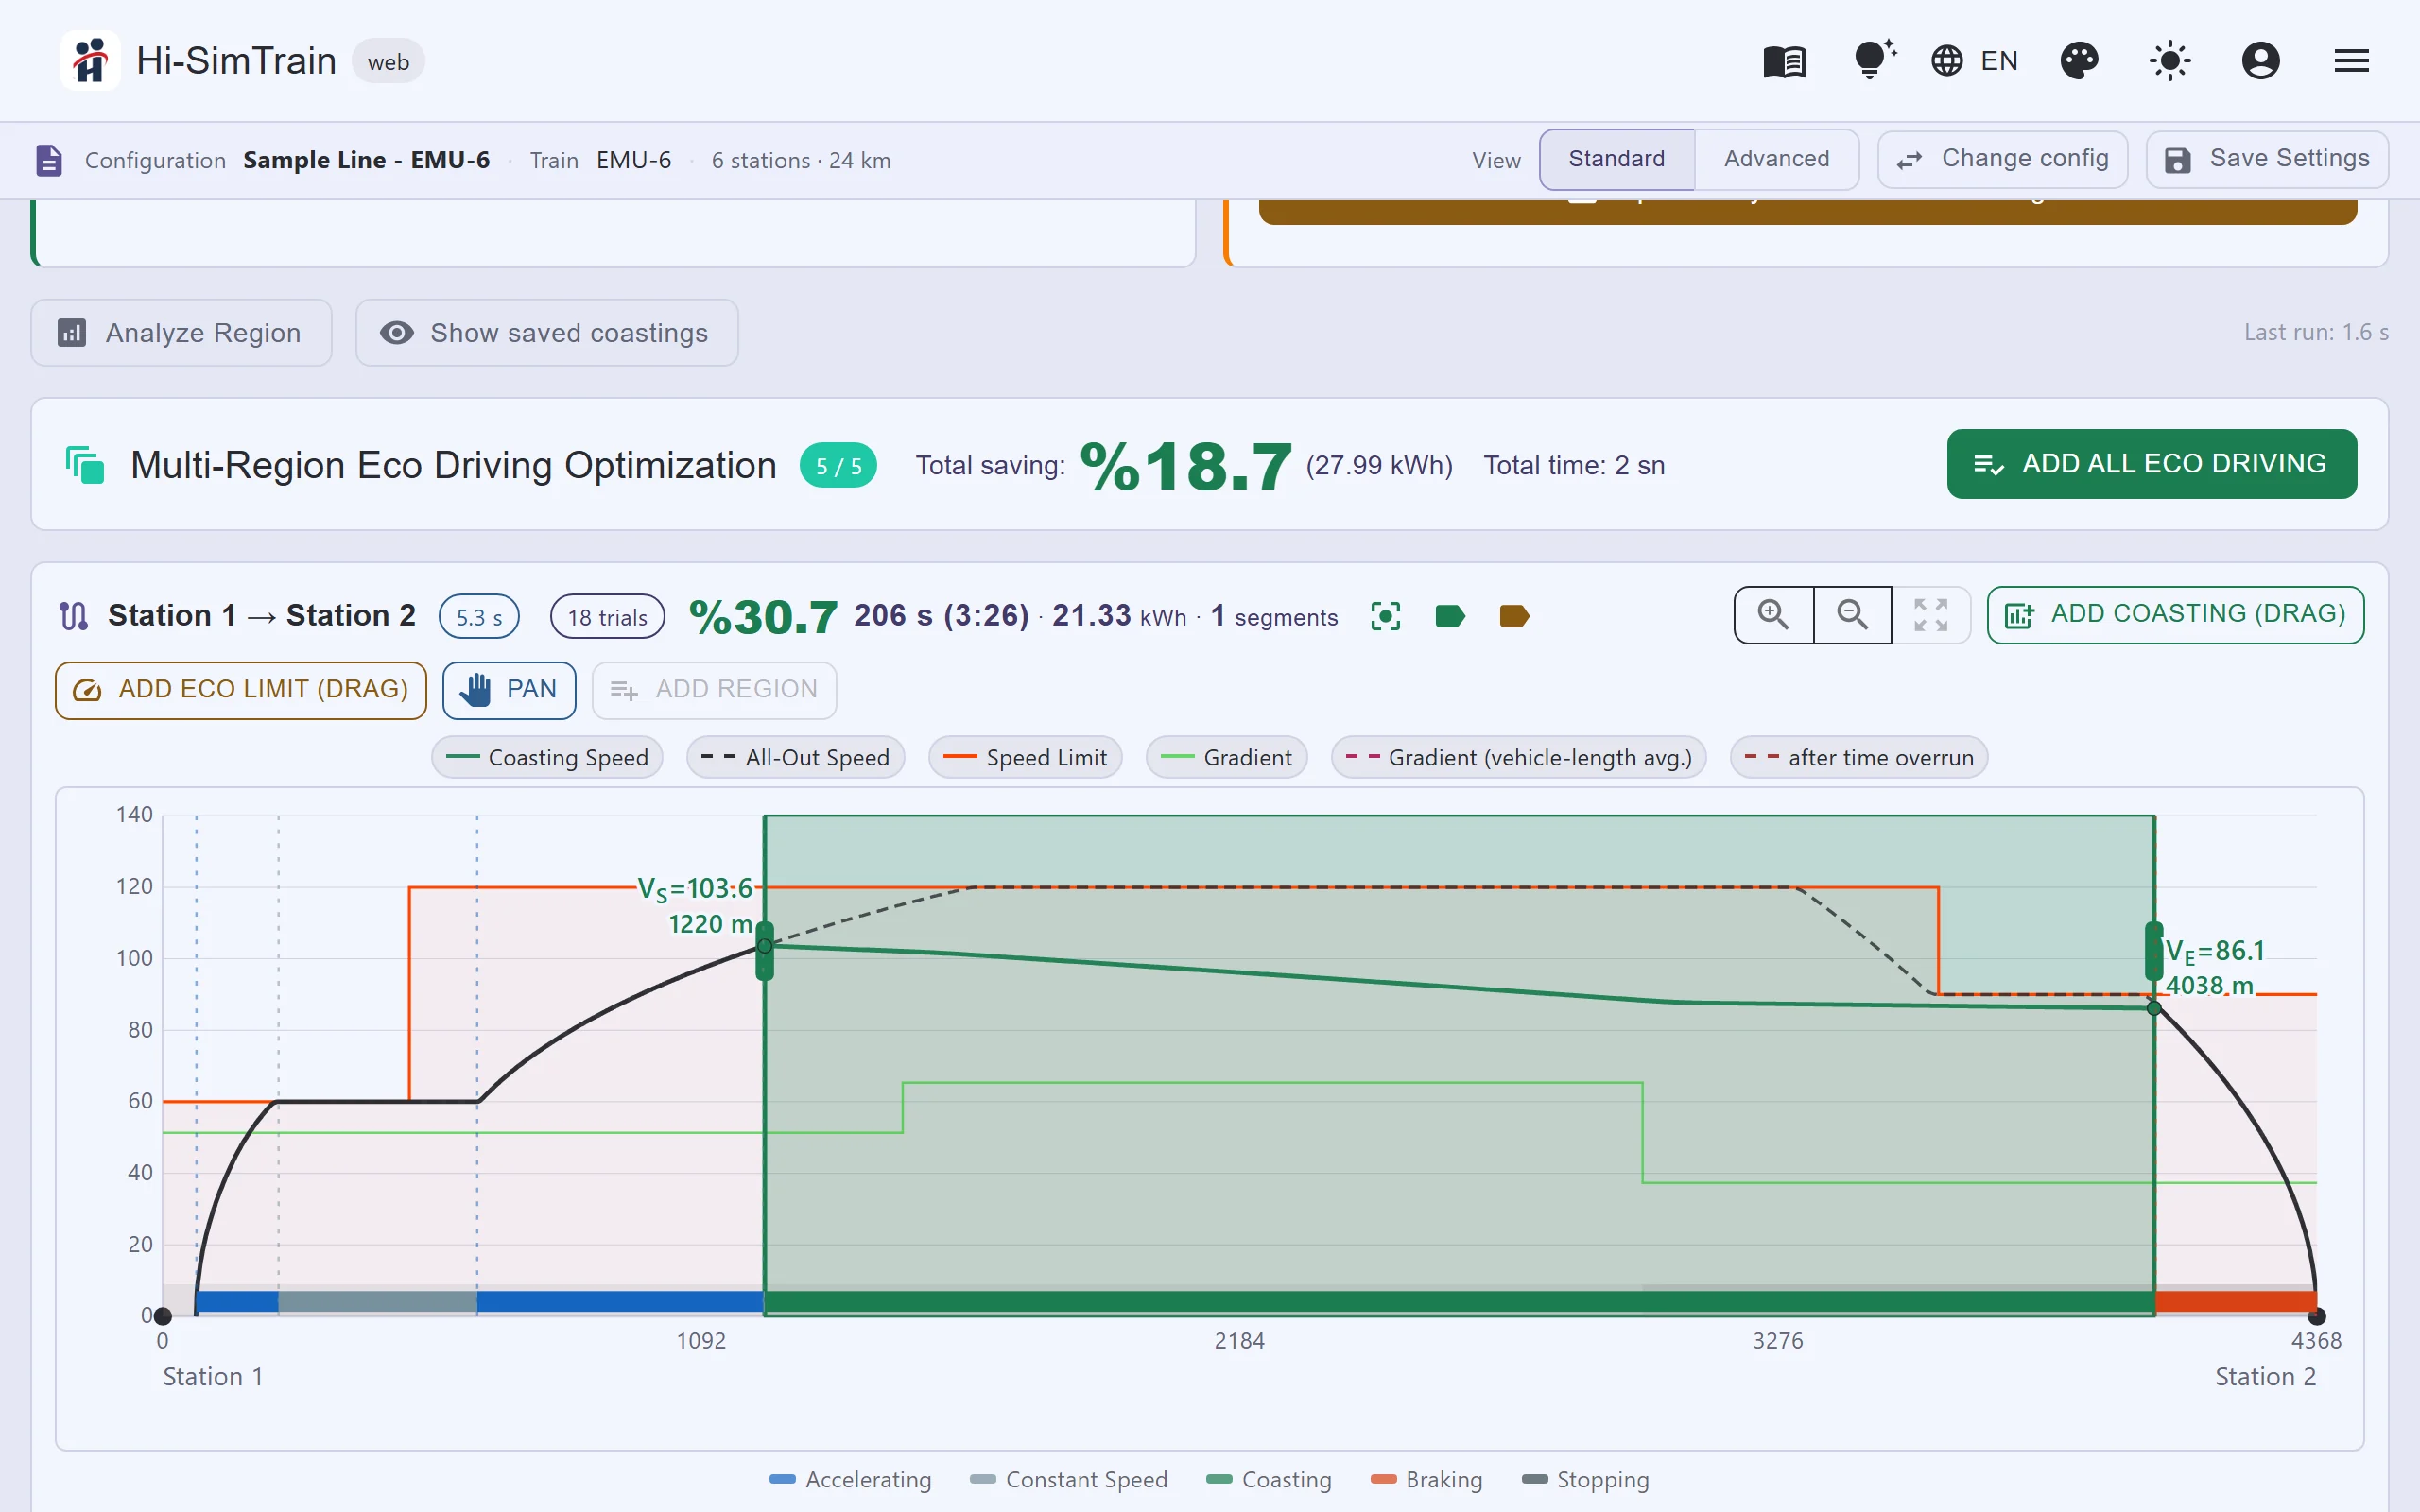
- Charts: The speed-position chart shows speed limit, gradient, eco limit and driving state (accelerating, cruising, coasting, braking) together.
- Strategy comparison: Time and energy difference between all-out, eco driving and the current run in the same section; the separate contribution of coasting and of the eco limit.
- Detailed logging: A time-step mechanical log can be downloaded as CSV; the Chart Viewer draws custom charts on any axes.
04Eco-driving optimisationOptimisation looks for the driving that uses the least energy without exceeding the timetable. The user sets the time budget; the system proposes coasting windows and, where useful, eco speed limits.
- Section and time budget: One station pair or the whole line (each consecutive section is optimised separately); the budget is given as a percentage or a target time, the fastest feasible time is shown and an unreachable target is reported clearly.
- Automatic coasting search: Searches the coasting start position, coasting speed and re-motoring speed; an optional multi-variant search runs longer for a better result.
- Manual mode: Coasting and eco speed limit zones are drawn by dragging on the chart.
- Speed limit reduction: Line speed limits are reduced proportionally without coasting; exempt limits and a lower bound can be set.
- Result and rationale: Energy saving (kWh and %), time used and each measure's share of the saving; a result you accept is added to the configuration.
- Joint proposal with eco speed limits (beta): a proposal that weighs coasting and eco speed limits together.
05Eco-driving reportTurns simulation results into a document for management and stakeholders.
- All-out and eco (coasting) strategies are compared station by station on the chosen route.
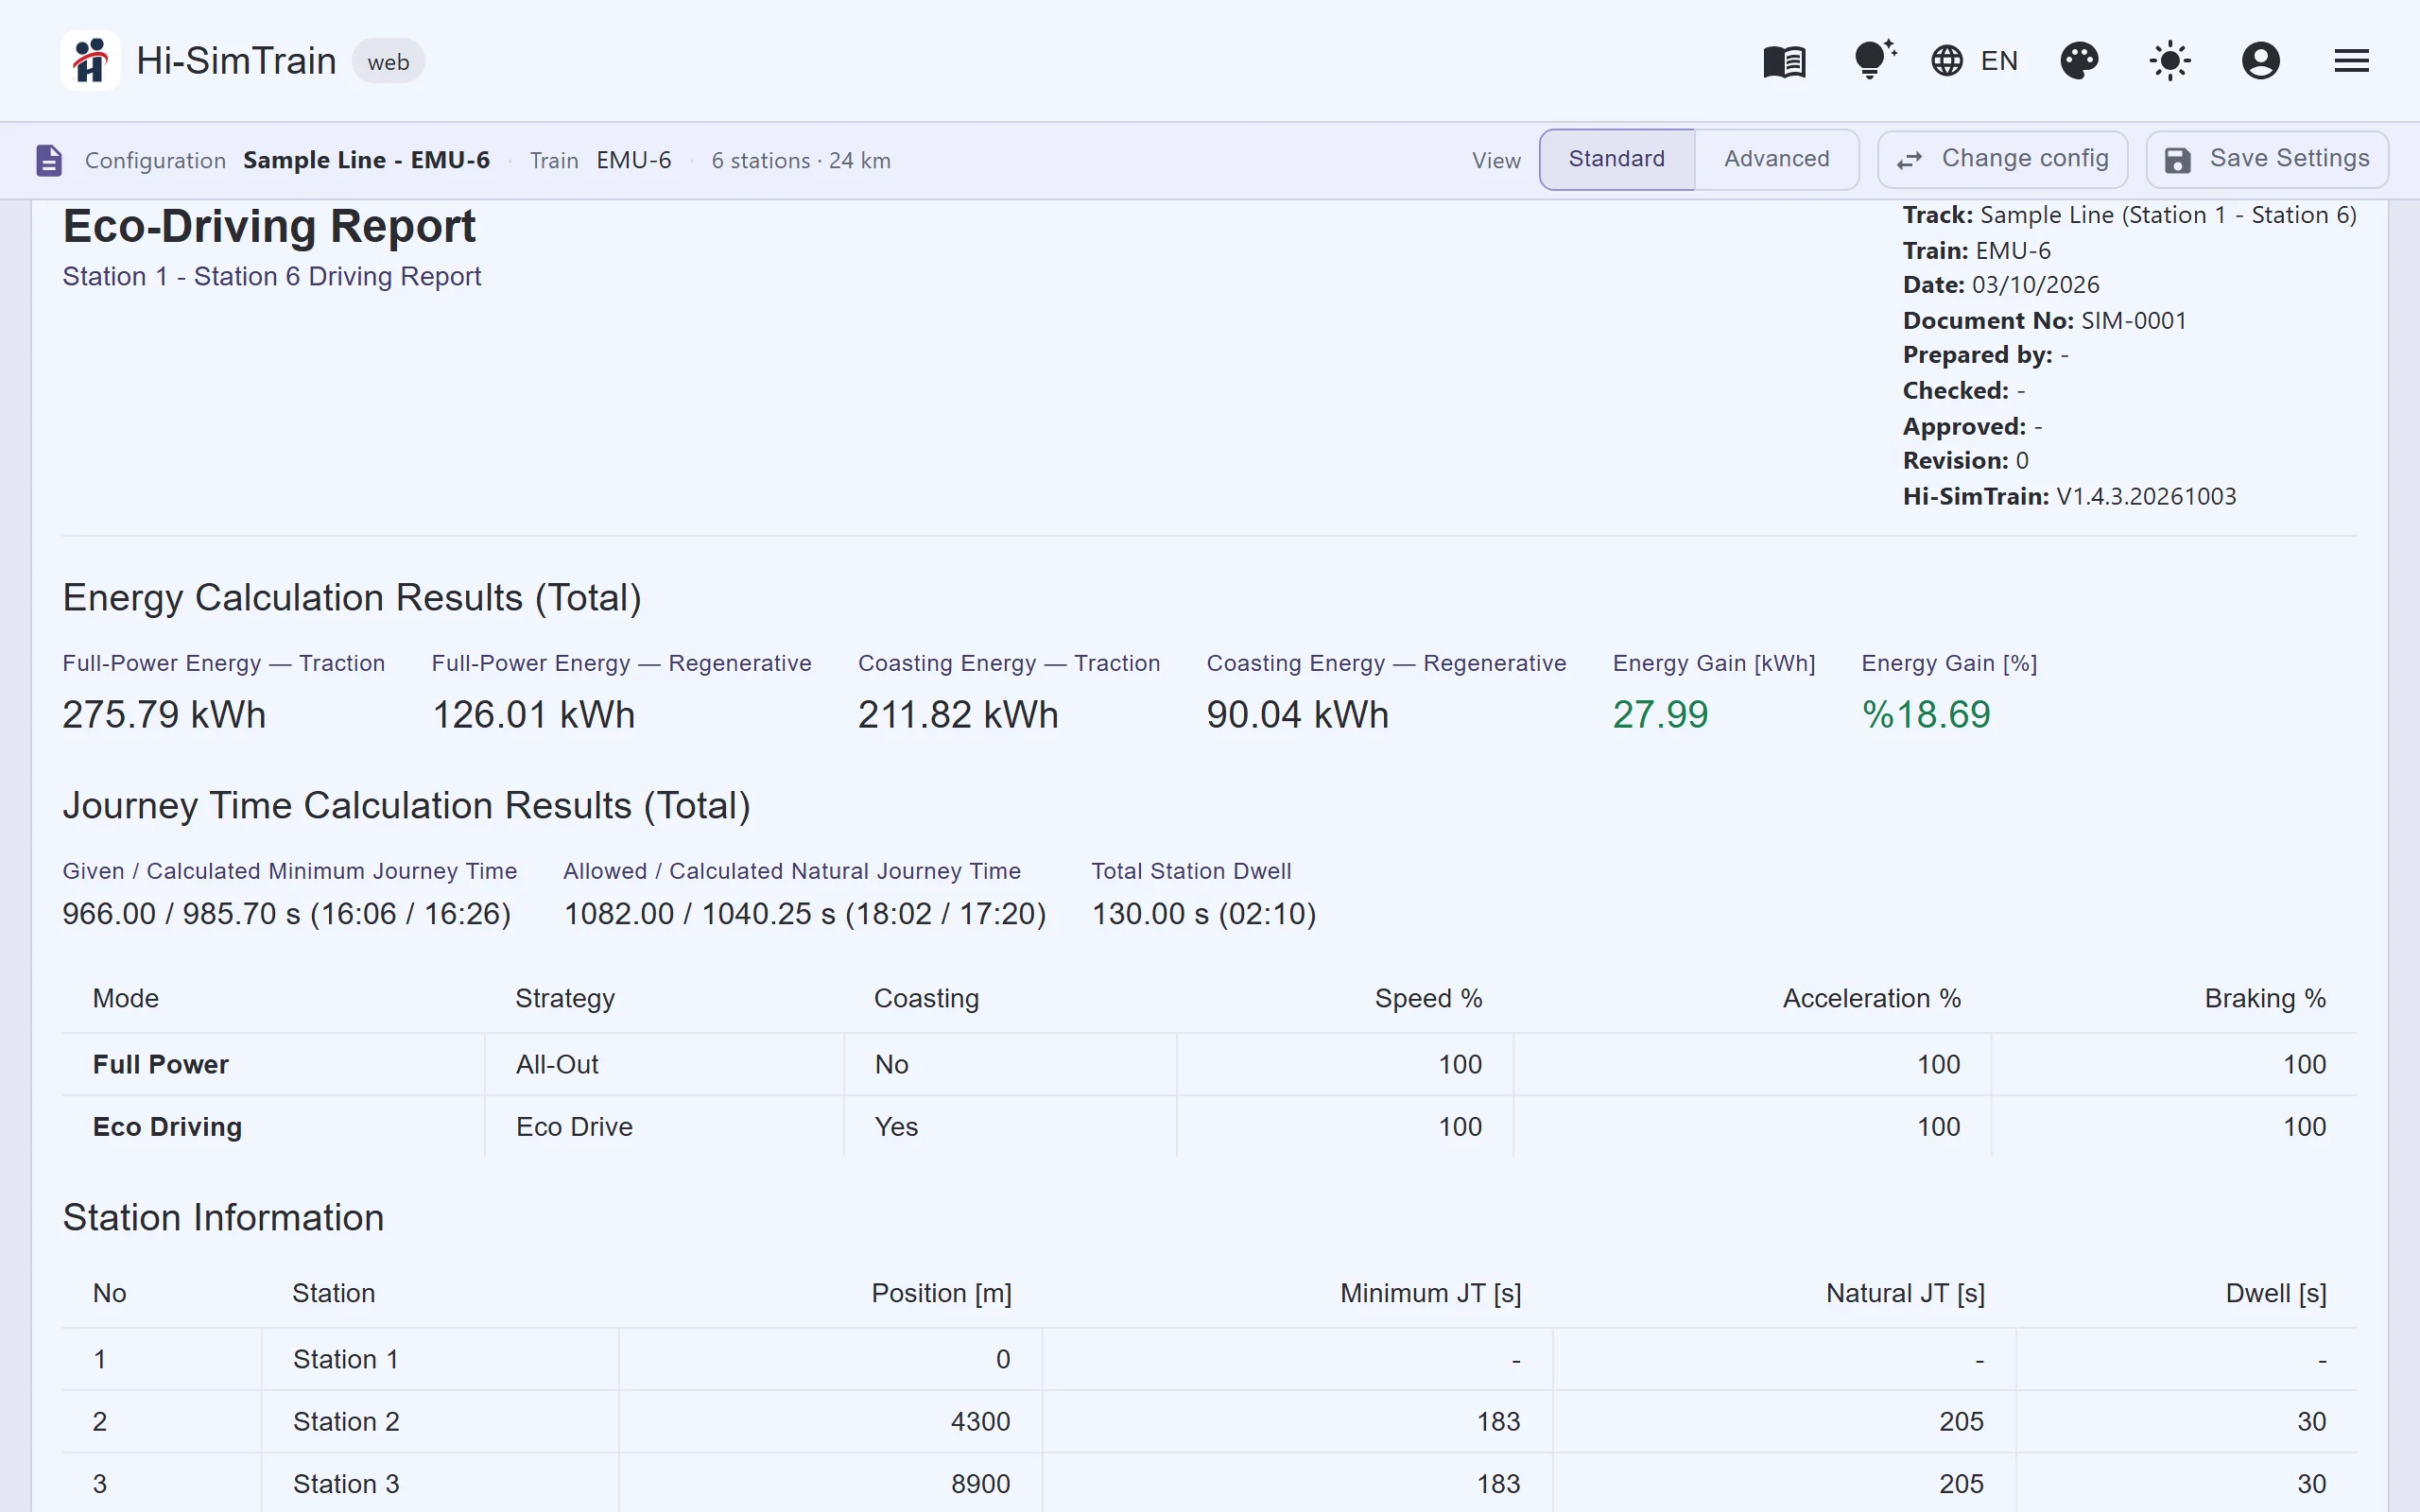
- Running time; traction, regenerative and total energy; energy saving in kWh and percent; time cost and energy gain of eco speed limits.
- Coasting zones and chart series are included in the report.
- Printable PDF with header, notes and logo; a default report logo can be set per organisation.
06Train Control SimulatorA real-time driving simulator to experience on screen what the driver will see in the cab.
- A control lever from full brake to full power; keyboard control is also available.
- Line diagram, speed-position chart, speed limit warning and energy readout update live.
- The advisory profile comes from the line's stored coasting windows, or is recomputed dynamically while driving.
- An autopilot follows the advisory profile and pauses when the user takes over.
- Expected (all-out and eco) and actual driving are compared.
07Advisory profiles and data service for HISIMDASHi-SimTrain is the back end of the HISIMDAS driver app. Every piece of advice shown in the cab comes from this service.
- Advisory profile calculation: For each station-to-station leg a profile of speed, position, acceleration and driving state is produced; the coasting zone is sent with it.
- Static and dynamic mode: Static mode uses the coasting windows stored for the line; dynamic mode recomputes the coasting start during the trip from the time remaining.
- Line and train data delivery: Line list, line data, trains and simulation parameter sets are served to the app; line geometry is sent in compressed blocks and only changed blocks are downloaded again.
- Data version: When a line, train or parameter set changes on the server, the app notices and refreshes only the changed record.
- Trip upload: The trip's position and speed record, motion sensor record and trip summary are uploaded; uploading can be switched off per user, in which case the data stays on the device.
08ReportsSee the Reports section below. In short: every trip is compared with its advisory profile and receives a driving score from 0 to 100; rankings, trends, energy and punctuality indicators are available by trip, driver, line and fleet.
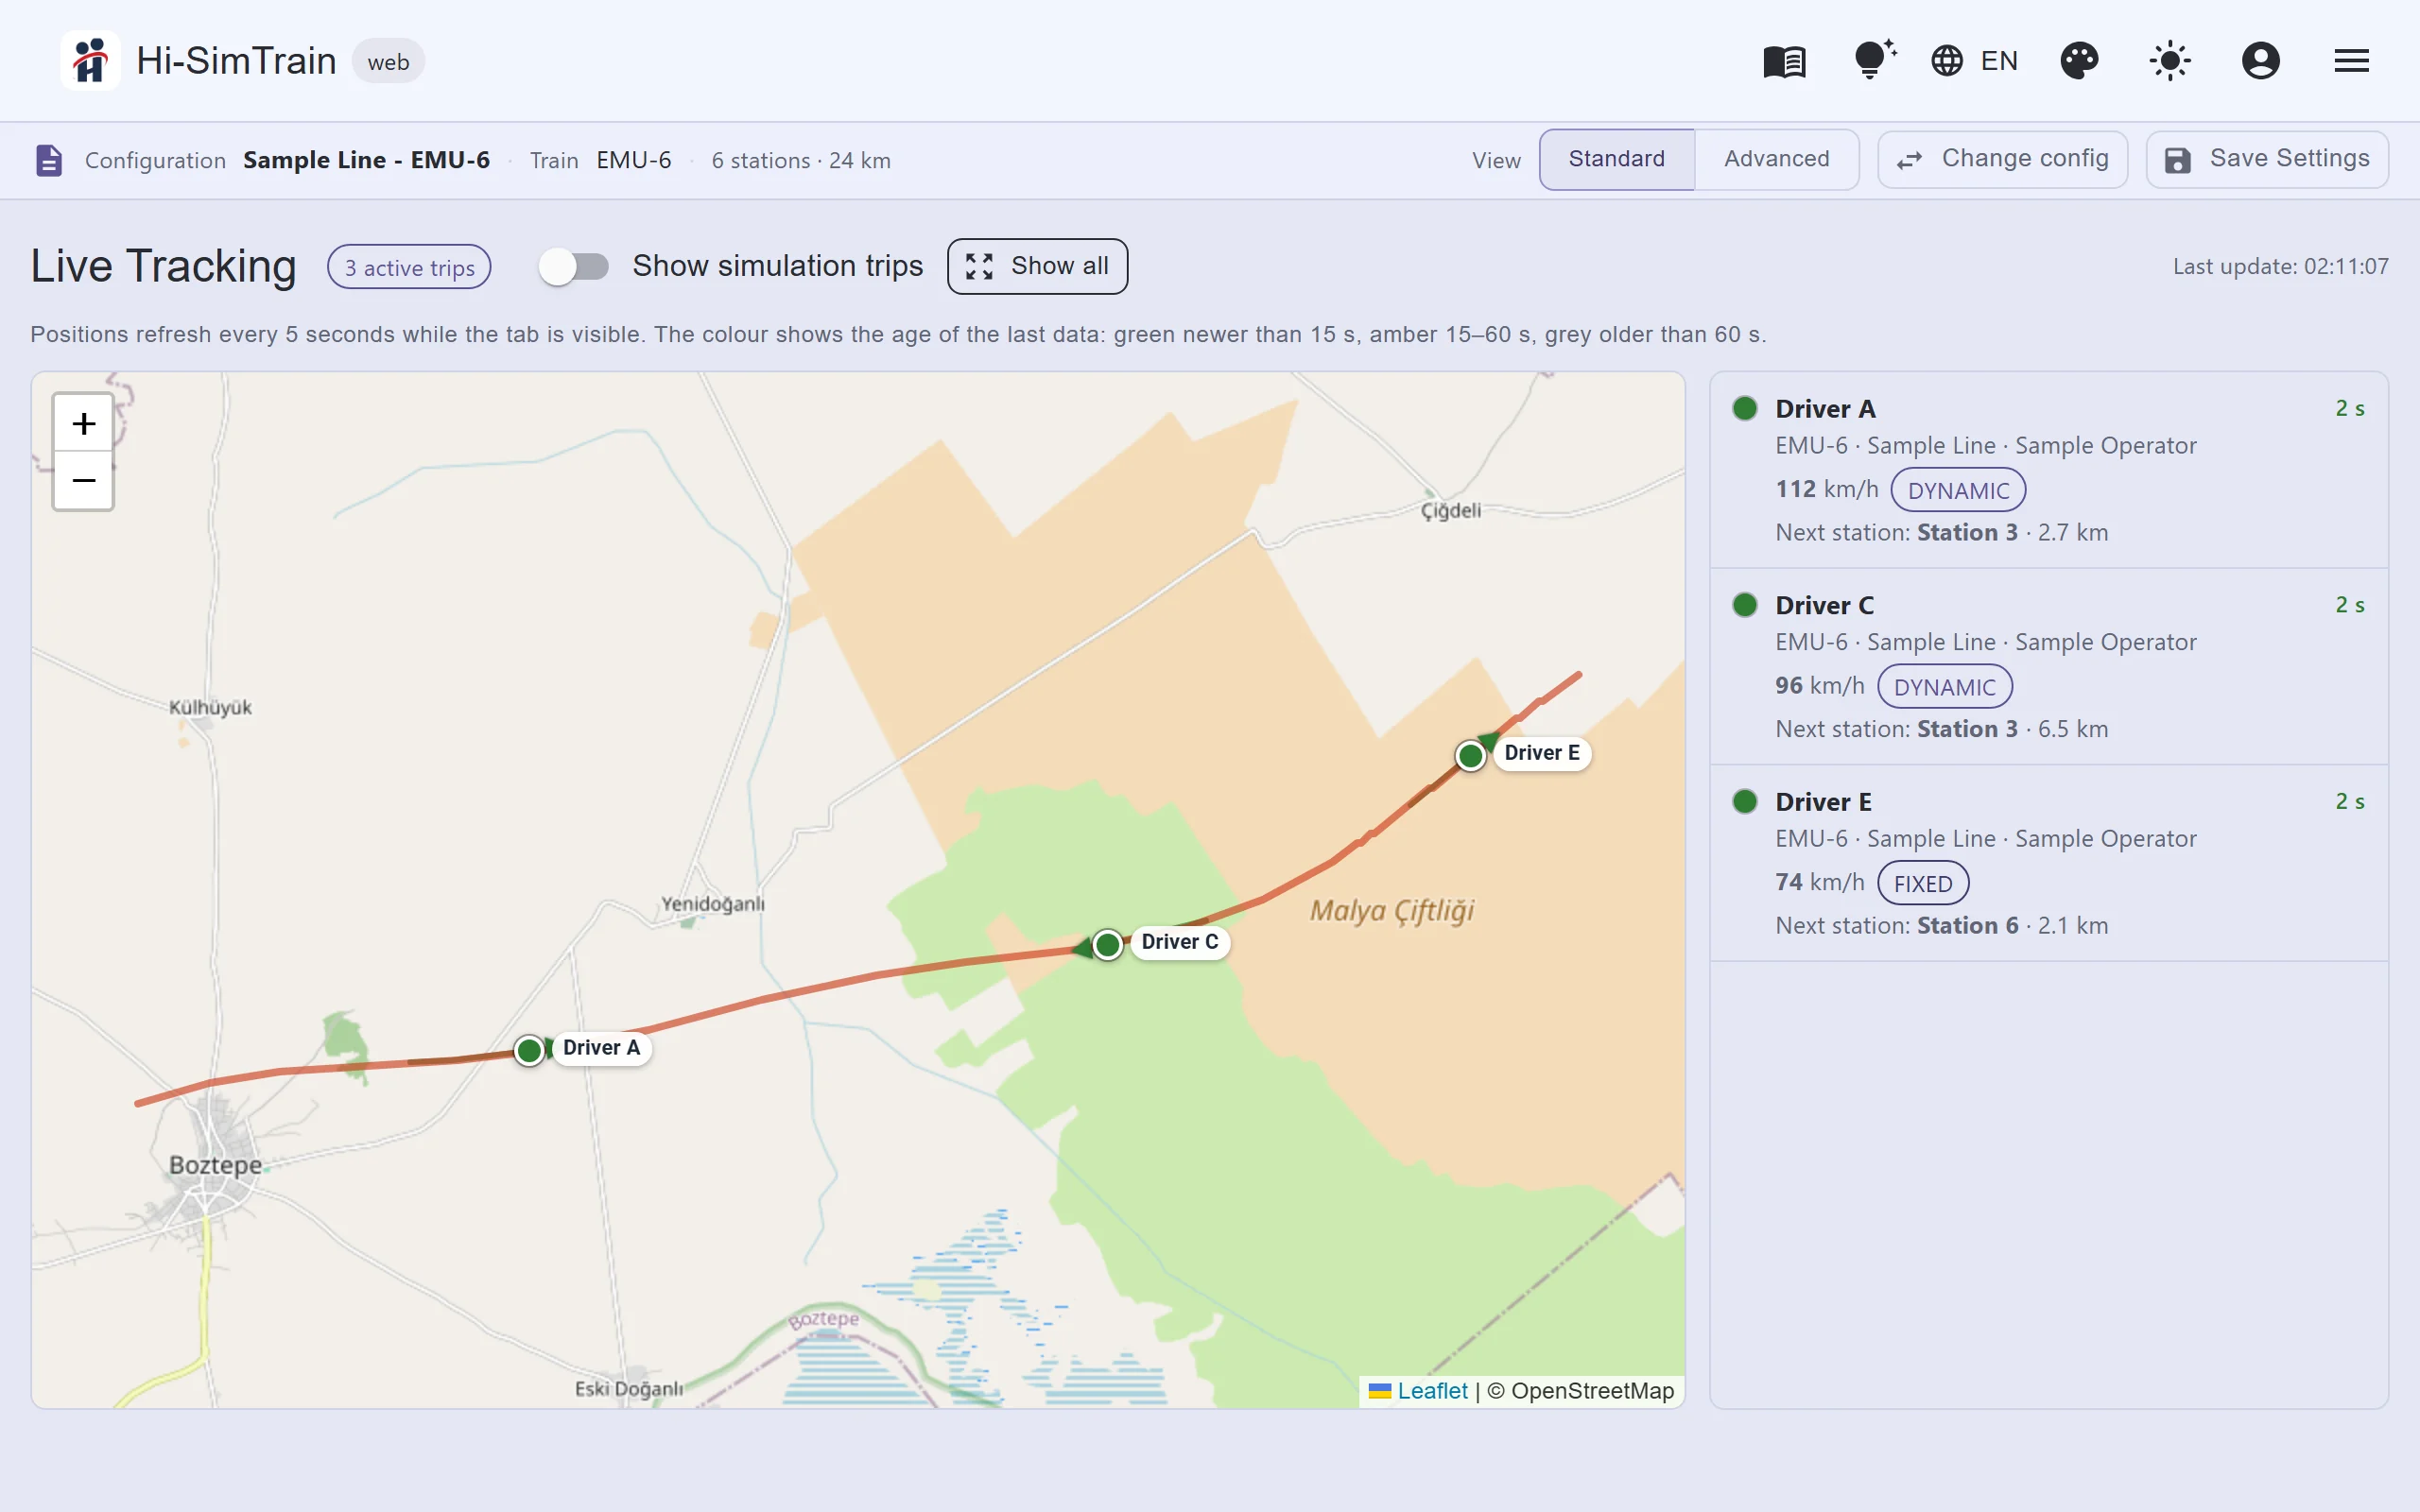
09Live trackingManagers follow active trips in the field on a map in real time.
- Active trips on a map refreshed every five seconds; the colour shows how recent the last data is.
- For each trip: driver, speed, next station and remaining distance, plus a trail of recent positions.
- Organisation admins see their own organisation; system administrators see all.
- Simulation trips are marked separately and can be hidden.
- Neighbouring lines are drawn in clearly distinguishable colours.
10Central management of the mobile appHISIMDAS settings are managed centrally from the web, not device by device.
- Settings catalogue: Display, advice and warnings, mode, position processing, data and app groups; each setting has a type, a range and a defined moment of application (immediately, at the next section, at the next trip).
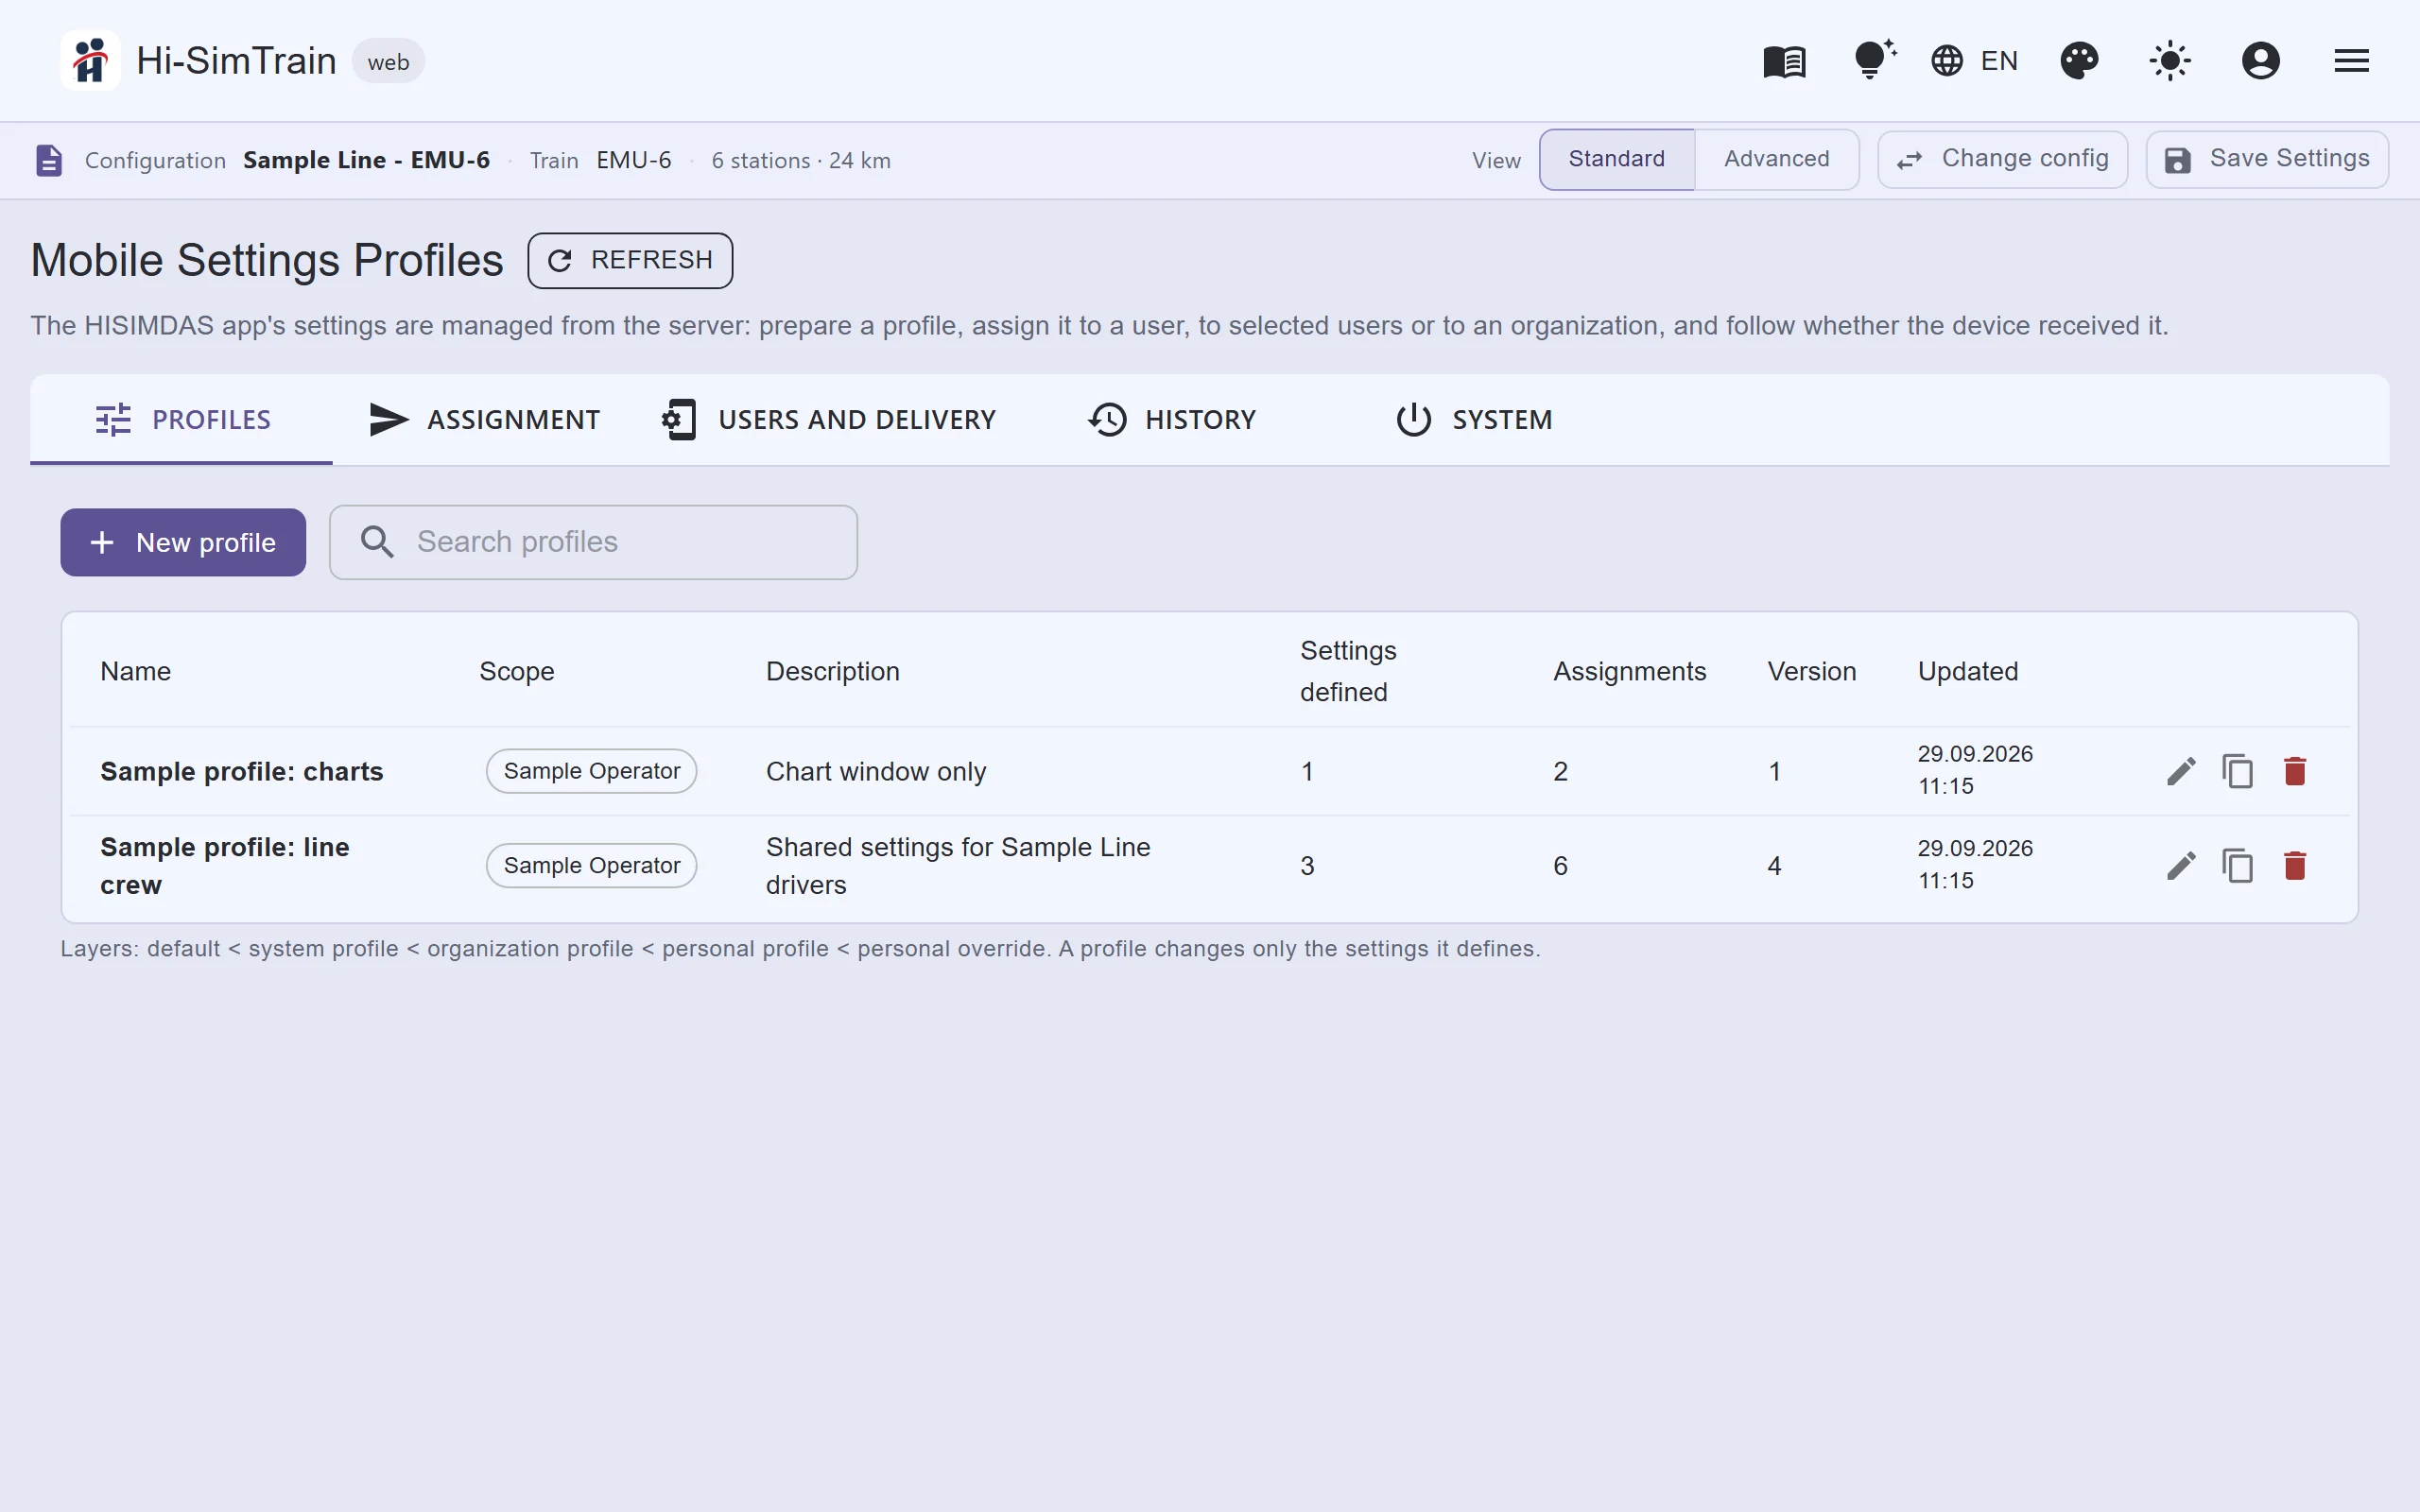
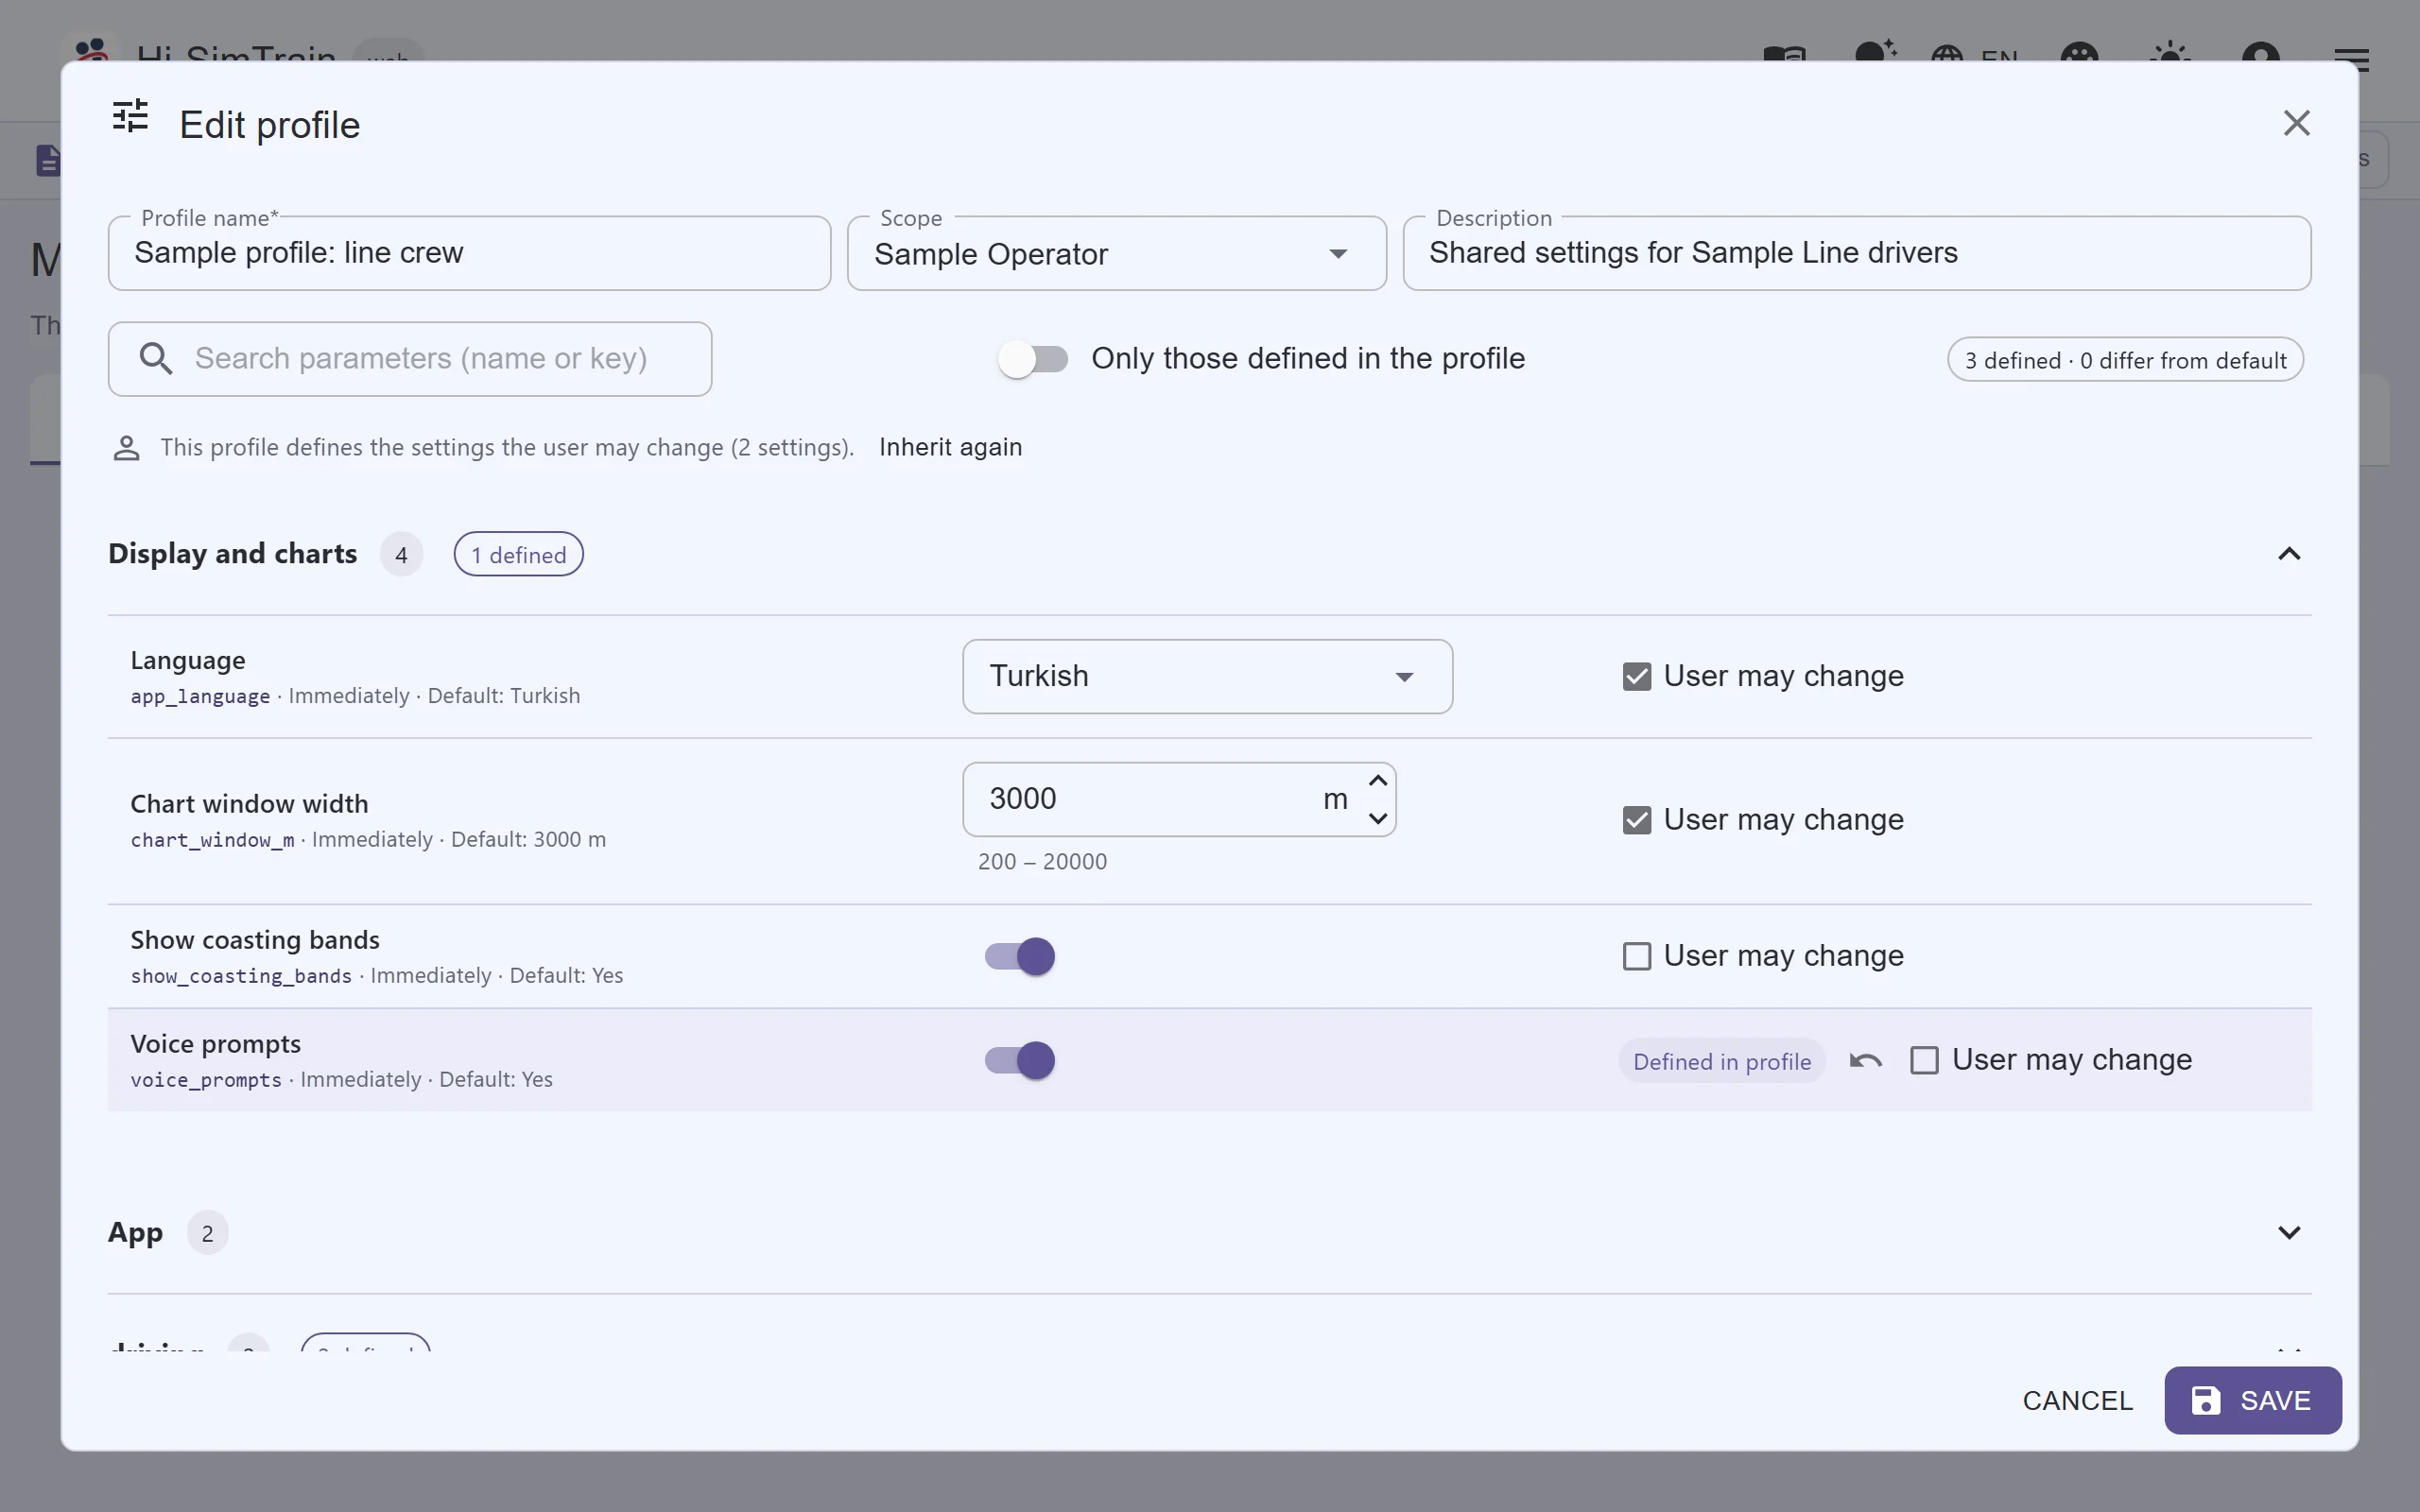
- Profiles and layers: Settings profiles are assigned at system, organisation and user level; per-user exceptions are possible. Before assigning, a preview shows whose settings will change.
- Locked or free: You decide which settings drivers may change themselves; managed settings appear locked in the app.
- Delivery tracking: For every user you see whether the settings reached the device and were applied, with app version, platform and device.
- Change history and a system-wide switch to stop live data intake.
- Fast sync: The app asks every few seconds whether anything changed and fetches only the changed settings; no third-party notification service is needed.
11Users, organisations, roles and permissionsAn account and permission model built for several organisations.
- Roles: User, Organisation Admin and System Administrator, plus a Driver account that can sign in to the mobile app only.
- Organisation separation: An organisation admin sees only the users, trips and reports of their own organisation.
- Approved account lifecycle: A user added by an organisation admin can sign in once a system administrator approves; an account deleted by an organisation admin is first deactivated and is removed permanently only with a system administrator's approval; a deactivated account can be reactivated.
- Account details: Organisation, department, region, trial or licence end date, last sign-in; strong password generation.
- Screen permission matrix: Each screen is set to full access, read-only or closed for each role; a closed screen disappears from that role's menu.
- Support permission: An organisation admin can be allowed to view and correct the configurations of users in their organisation.
12Monitoring, records and sign-in historyShows who uses the platform, how, and how loaded the server is.
- User monitoring: Who is online, on which screen, whether a job is running and how much computing resource it uses; most-used screens and daily time per screen.
- Server load monitoring: Live load of the optimisation server, the queue and recent runs; resource usage history.
- Sign-in history: Successful sign-ins and active working time per day, month and year.
- Action record: Administrative actions on accounts, configurations, trips and station positions are recorded.
- Error and event logs: Users choose the detail level and retention of client-side logs, and the screen states plainly what is never sent; administrators filter and review all users' error records.
13Configuration management and data syncA study's line, train, coasting and eco limit data lives in a single configuration file stored on the server.
- Server storage: Configurations are saved and read back for verification; if the connection drops they wait in a queue and are written later; on a new device they are restored from the server.
- Backups: Recent versions of each configuration are backed up automatically, identical content is not backed up twice, and a deleted configuration can be restored.
- Library and bulk distribution: Ready-made configurations are kept in library folders and sent to selected users in one operation; if the name already exists, the old version is backed up and then updated.
- Automatic repair: Damaged data in a loaded configuration is detected, repaired and reported to the user.
- One central data set: Web, desktop and mobile app use the same line, train and trip data; personal display preferences travel with the account.
14Web and desktop workspaceThe same capabilities are available in the browser and on the Windows desktop; the interface adapts to the user's experience.
- Web application: Nothing to install; every module works in the browser.
- Windows desktop application: Simulation, optimisation, eco-driving report, driving simulator, data entry, consistency check, driver advisory data and reports, Track Builder and administration screens; it connects to the same server and updates itself after confirmation.
- Two languages: The interface is available in Turkish and English.
- A view for every user: Standard and Advanced views, light and dark themes, task-grouped or classic menu, a short description on every screen and a user guide that opens at the relevant chapter.
15ExportsResults can be shared and archived outside the platform.
| Output | Format |
|---|---|
| Eco-driving report | PDF (print) |
| Driver advisory reports (open tab) | |
| Trip list | CSV |
| Mechanical log (time step) | CSV |
| Consistency report | CSV and PDF |
| Custom charts | PNG, SVG, PDF |
| Gradient comparison | Excel |
| Configuration | JSON |
Reports
Reports show whether the investment in eco-driving pays off in the field. Every trip is compared with the advice the driver saw in the cab and scored in the same way. On one screen the operator sees fleet adherence, energy and punctuality indicators, the driver ranking and where problems cluster along the line, and can drill down from any figure to the chart of a single trip.
What the operator sees
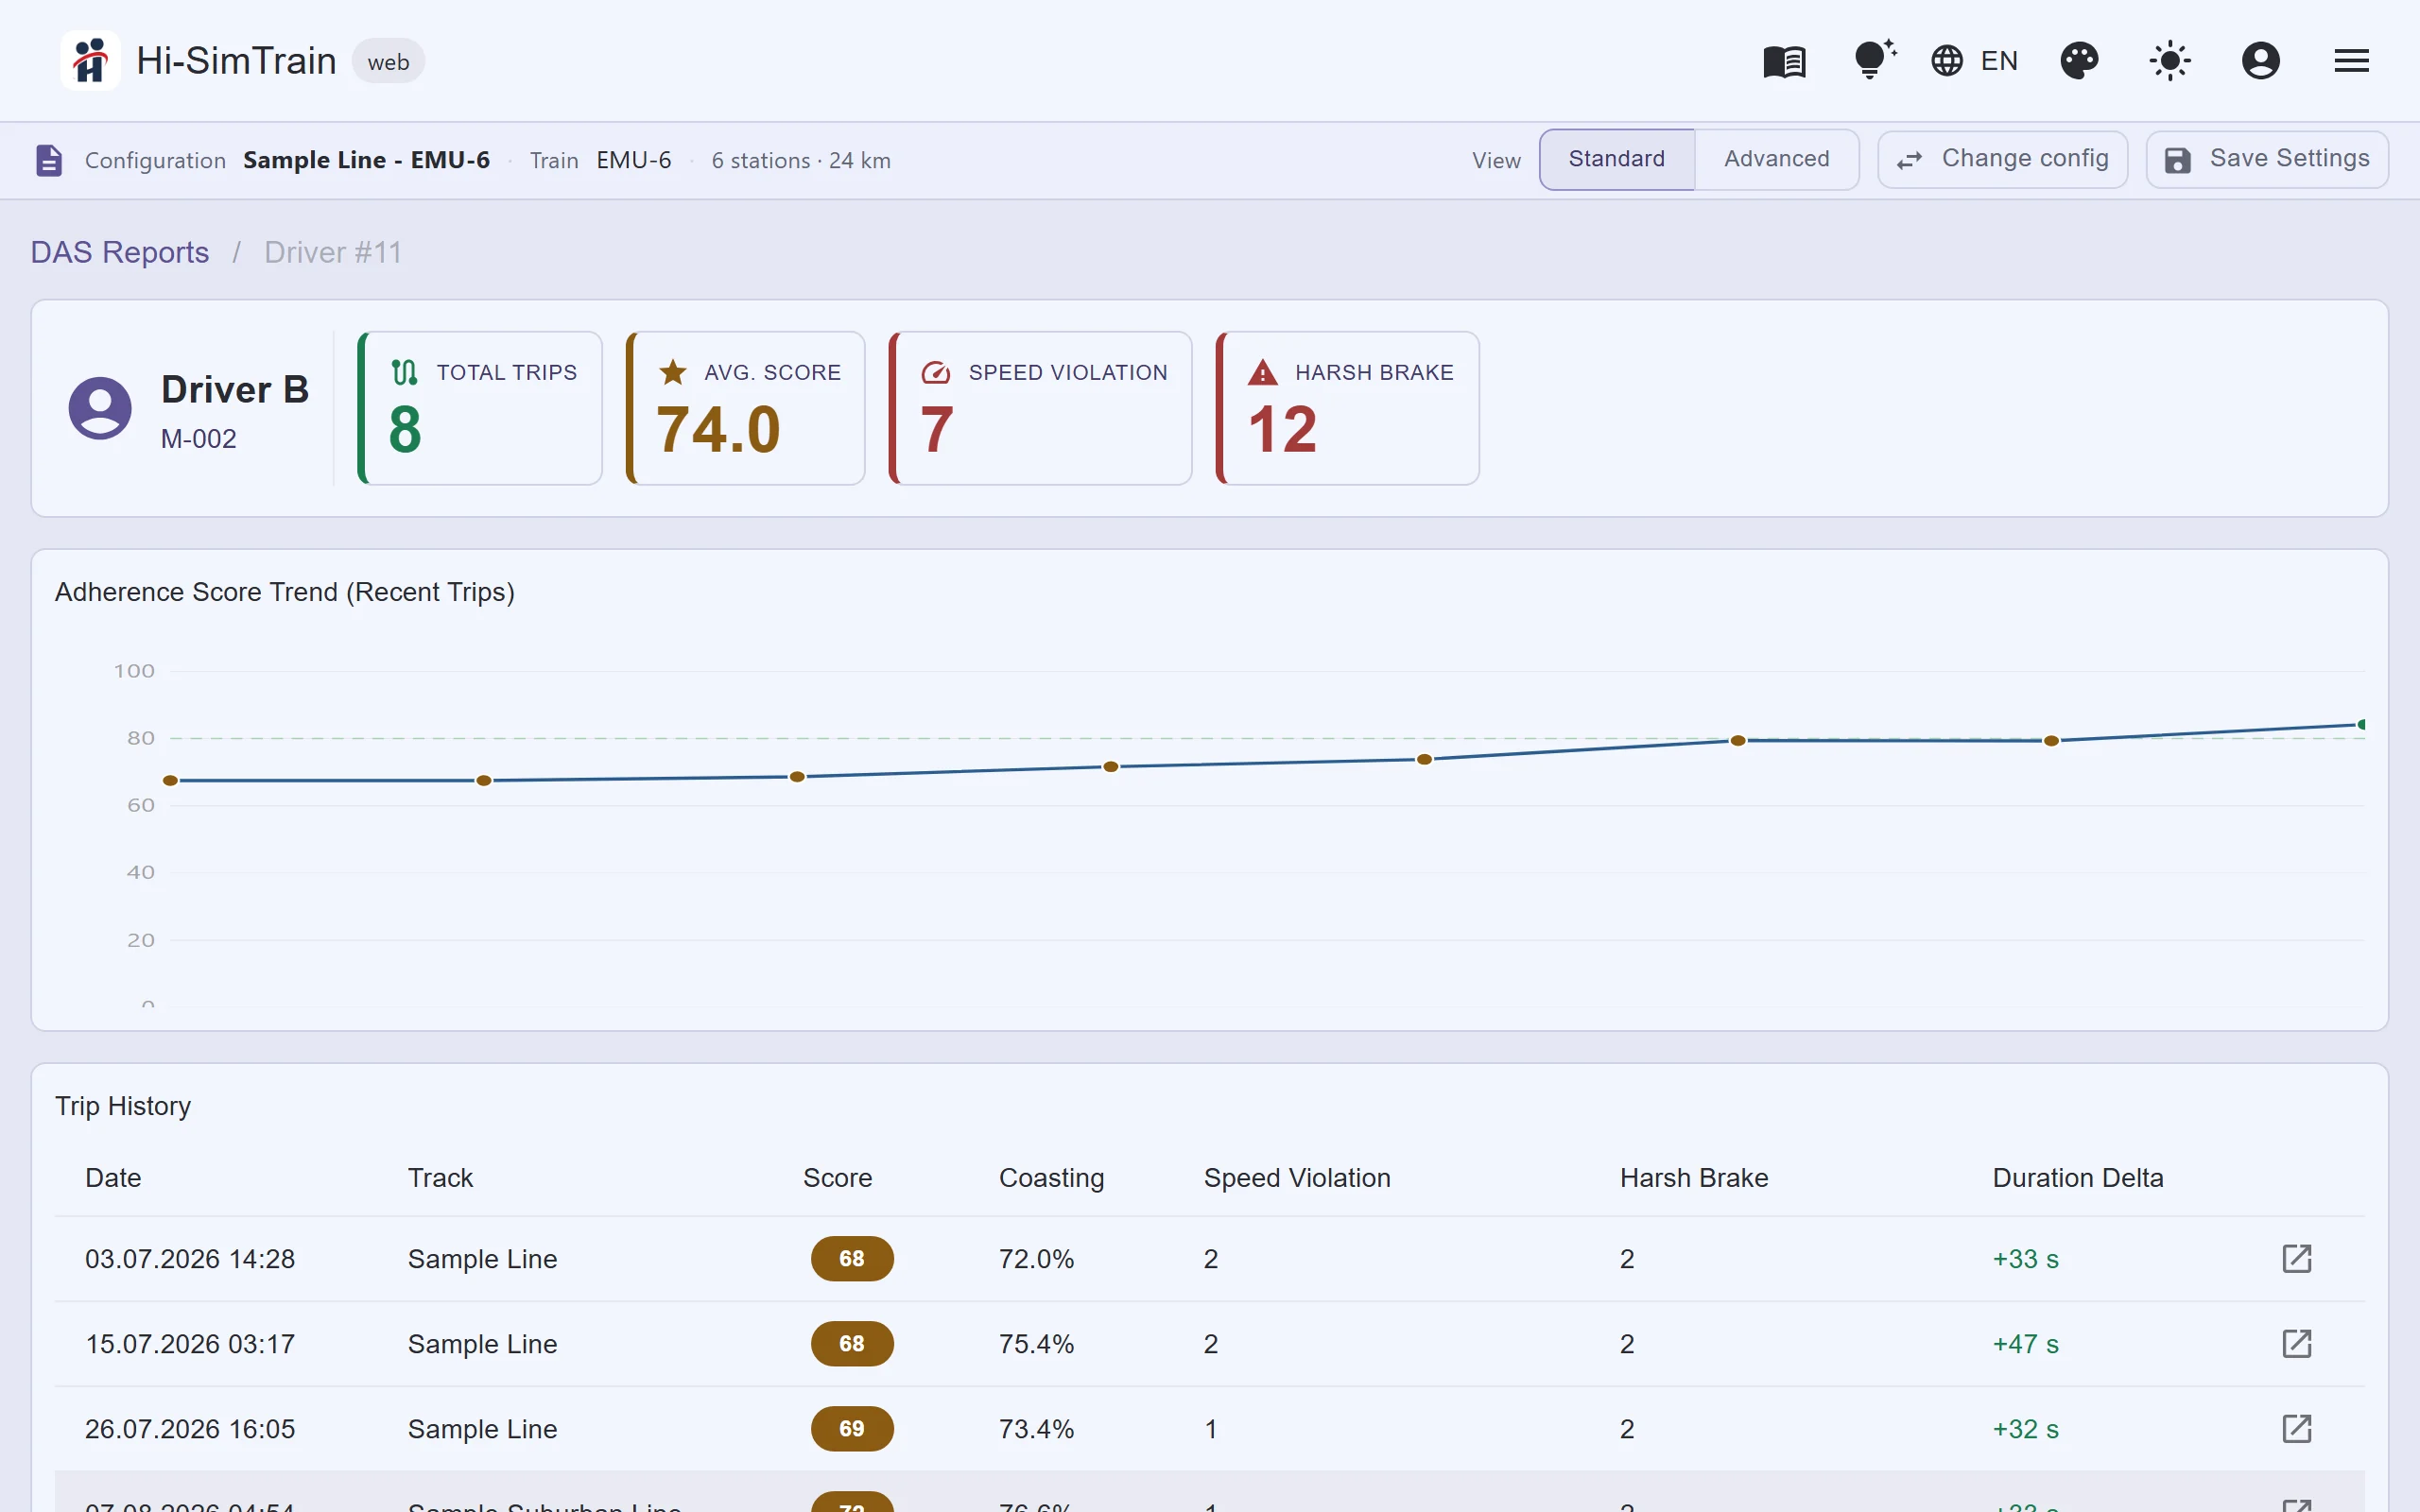
- Driver driving score: Every trip receives an adherence score from 0 to 100, built from four components (table below). An average of 80 or more is shown as good, below 60 as weak.
- Rankings: Best drivers across the fleet and a driver ranking for each line, ordered by average adherence score and shown with trip count, average energy waste and total speeding events.
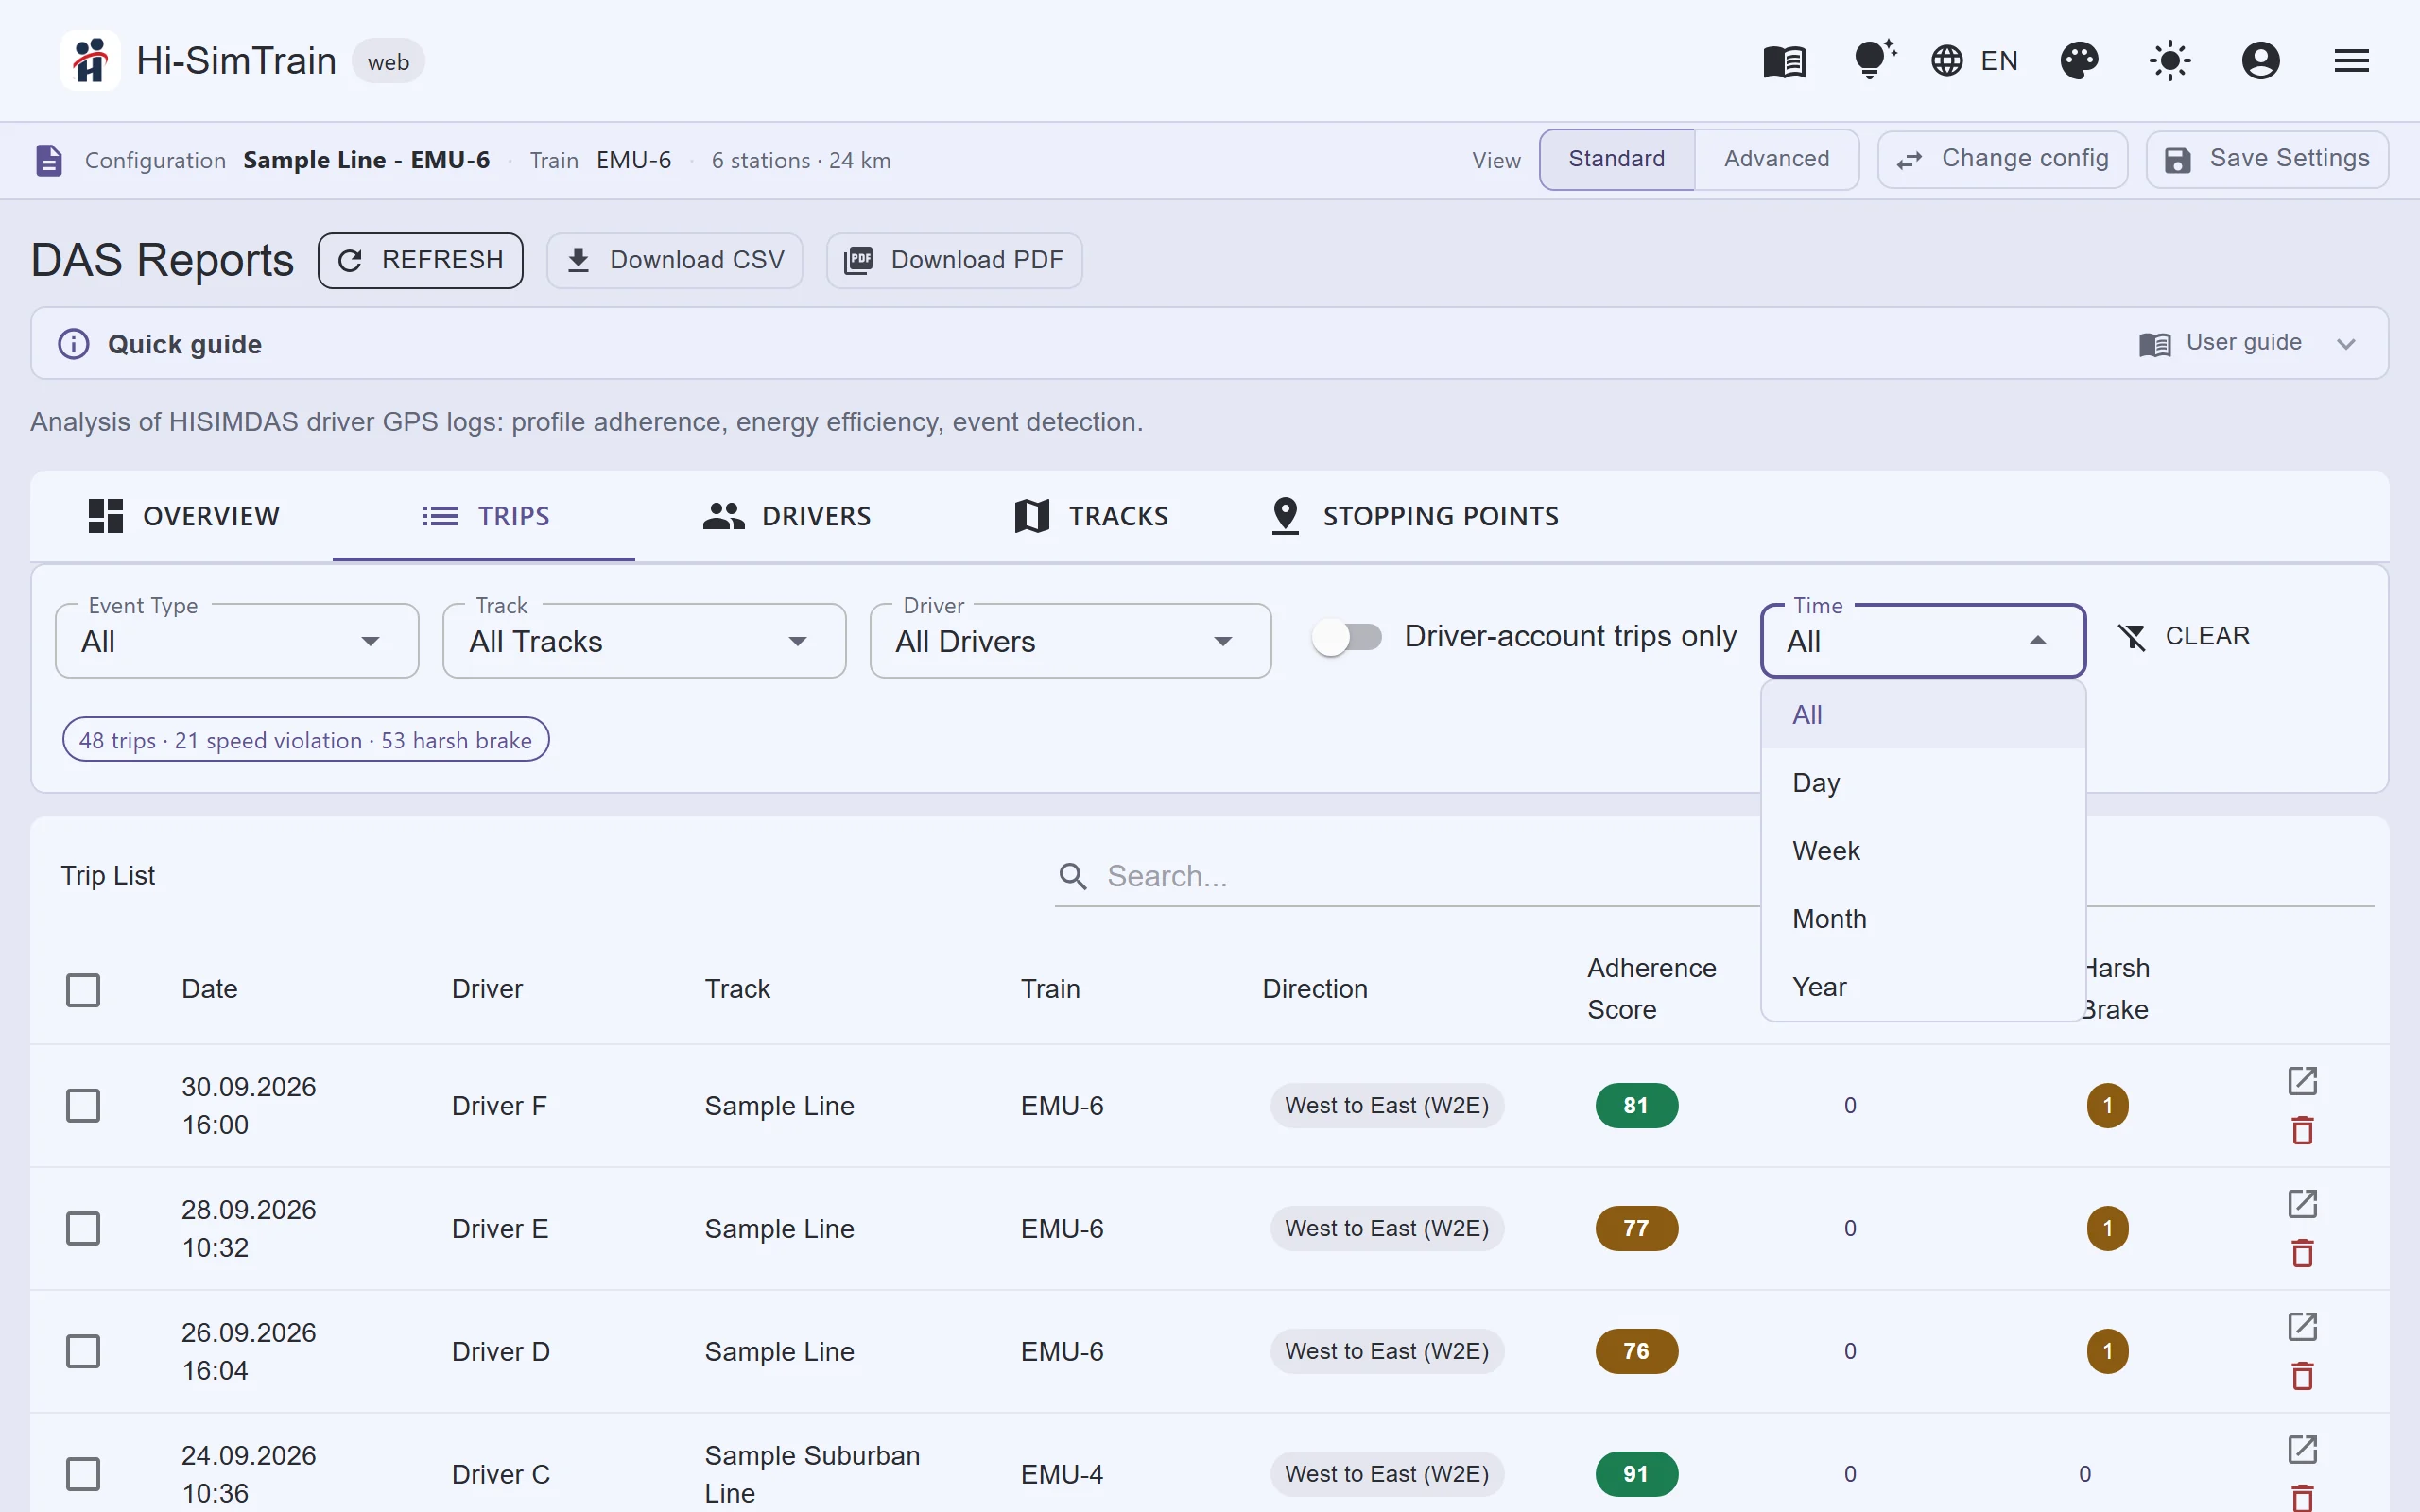
- Trends: A score trend chart of recent trips and the full trip history for each driver; the trip list can be filtered by day, week, month and year.
- Energy indicators: Average estimated energy waste by trip, driver, line and fleet; per section, between which stations energy is being lost.
- Punctuality indicators: On-time score and the time difference in seconds against the advised time; actual and advised time for each station-to-station section.
- Event map: Where along the line speeding, harsh braking and missed coasting are concentrated.
What the driving score is made of
| Component | Weight | How it is calculated |
|---|---|---|
| Speed adherence | 40% | Share of time the speed stays within the tolerance band around the advised speed (default band ±5%, adjustable in percent or km/h). |
| Coasting compliance | 25% | Share of time inside defined coasting zones spent without applying traction. |
| On-time arrival | 20% | Starts at 100; every 30 seconds of deviation from the advised time costs 5 points. |
| Driving smoothness | 15% | Starts at 100; each harsh brake costs 8 points, each harsh acceleration 5 and each speeding event 5. |
Benefits
- One yardstick for everyone. Every trip is scored by the same method; when the method is updated, older trips are recalculated when opened, so periods and drivers stay comparable.
- Faulty records do not distort rankings. Recordings from a device left on a desk, positions off the line or broken timestamps are not scored, so fleet averages come from real trips.
- Training goes where it is needed. The event map and section analysis show in which stretch and in which behaviour the problem lies.
- Feedback based on evidence. Advised and actual driving appear on the same chart, so the conversation with the driver is about a concrete trip.
Who uses it
| Who | What they see | What for |
|---|---|---|
| Driver | The end-of-trip summary in the app; their own trip details together with their manager | To see their own driving and improve coasting and braking habits |
| Depot / organisation admin | Their organisation's trips, driver profiles, line analysis, stopping points | To identify training needs, find problem stretches and improve line data |
| Management | Overview, rankings, energy and punctuality indicators, PDF and CSV exports | To follow fleet-wide adherence and trends, for decisions and reporting |
How a report is produced
2Check and calculate
3Score
Metrics
| Metric | What it tells you |
|---|---|
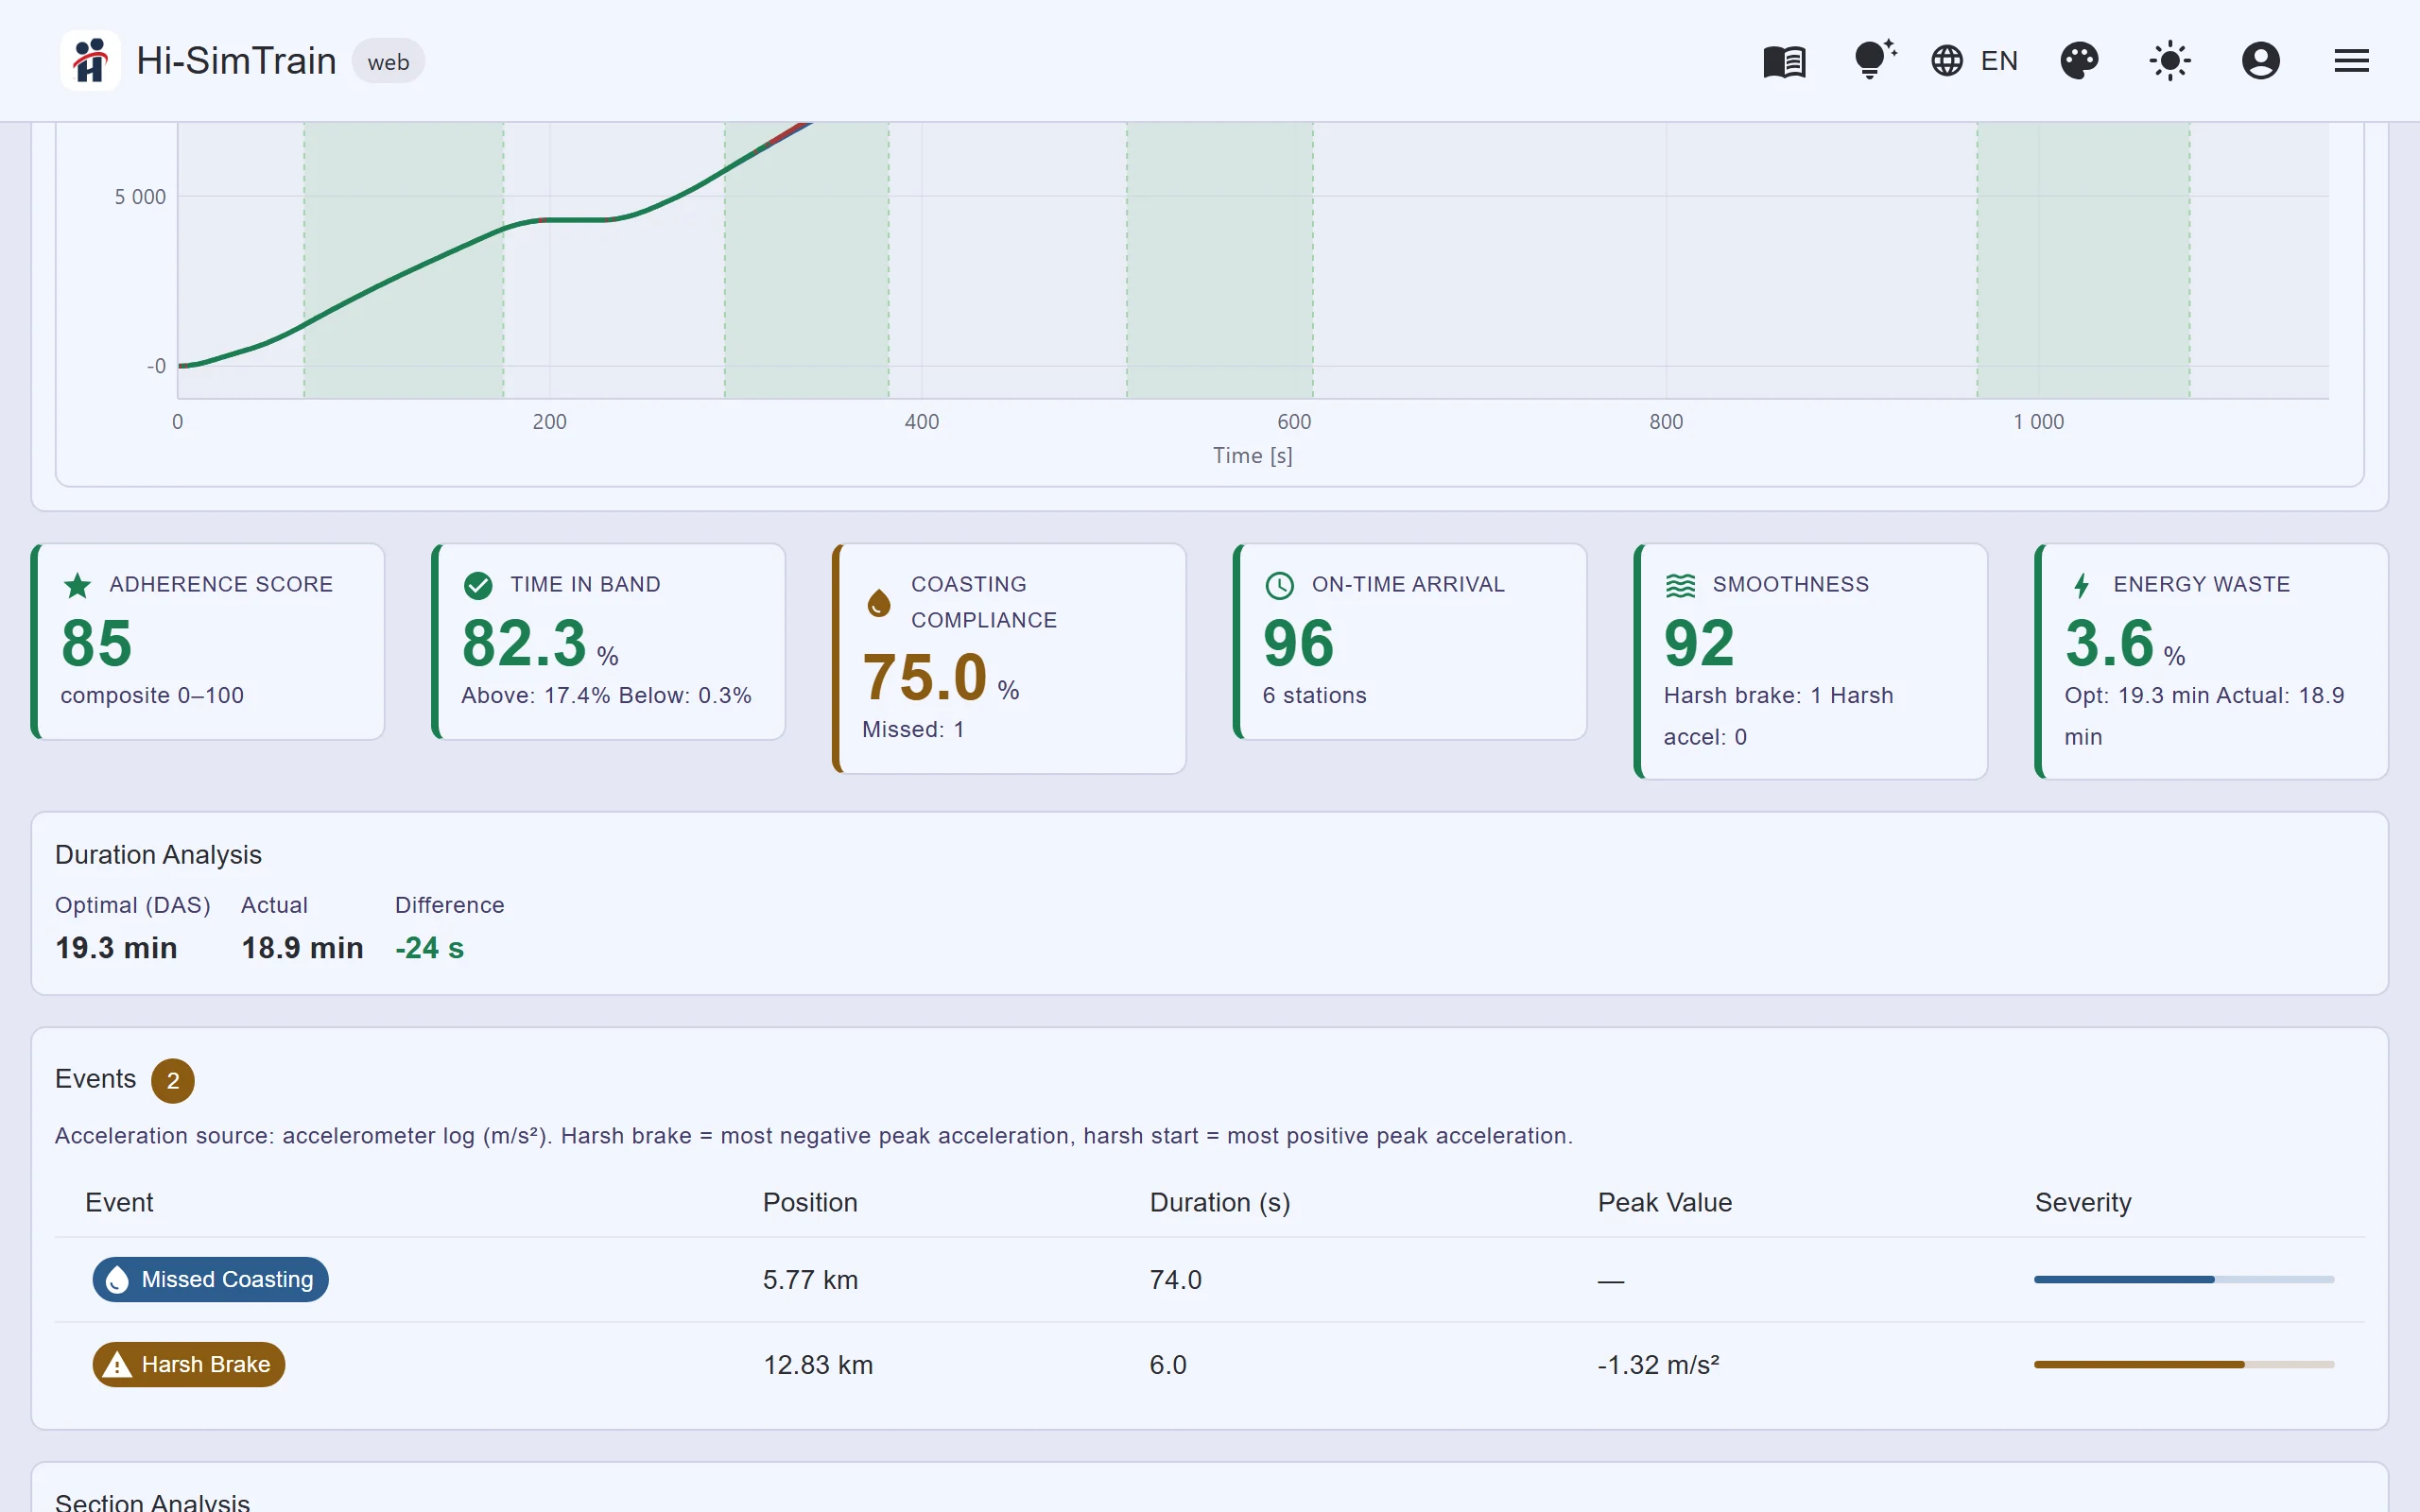
| Adherence score (0-100) | Weighted sum of the four components; overall adherence of the trip to the advice. |
| Time in band (%) | Share of time the speed stays within the tolerance band around the advised speed. |
| Above / below (%) | The part of out-of-band time spent above and below the advice. |
| Coasting compliance (%) | Share of time inside coasting zones spent without traction. |
| Missed coasting | Number of times traction was applied for at least five seconds inside a coasting zone. |
| On-time score | A score that falls as actual time departs from the advised time. |
| Time difference (s) | Actual minus advised time over the stretch covered by the advice. |
| Smoothness score | A score that falls with harsh braking, harsh acceleration and speeding events. |
| Speeding (count, duration) | Events where the lowest speed limit under the train is exceeded by more than 2 km/h, and their total duration. |
| Harsh braking / harsh acceleration | Deceleration and acceleration beyond an adjustable threshold (default -1.0 and +1.2 m/s²), with peak value and severity. |
| Estimated energy waste (%) | Relative estimate of the energy effect of driving faster than advised; a comparison indicator, not kWh. |
| Reference coverage (%) | How much of the line the advisory profile covers; tells you over which stretch the time and adherence comparison is valid. |
| Data health | Recording quality notes such as skipped stale samples, back-and-forth movement and time or position inconsistency. |
| Event density | Where events cluster along the line, with speeding-weighted and harsh-braking-weighted views. |
Report screens
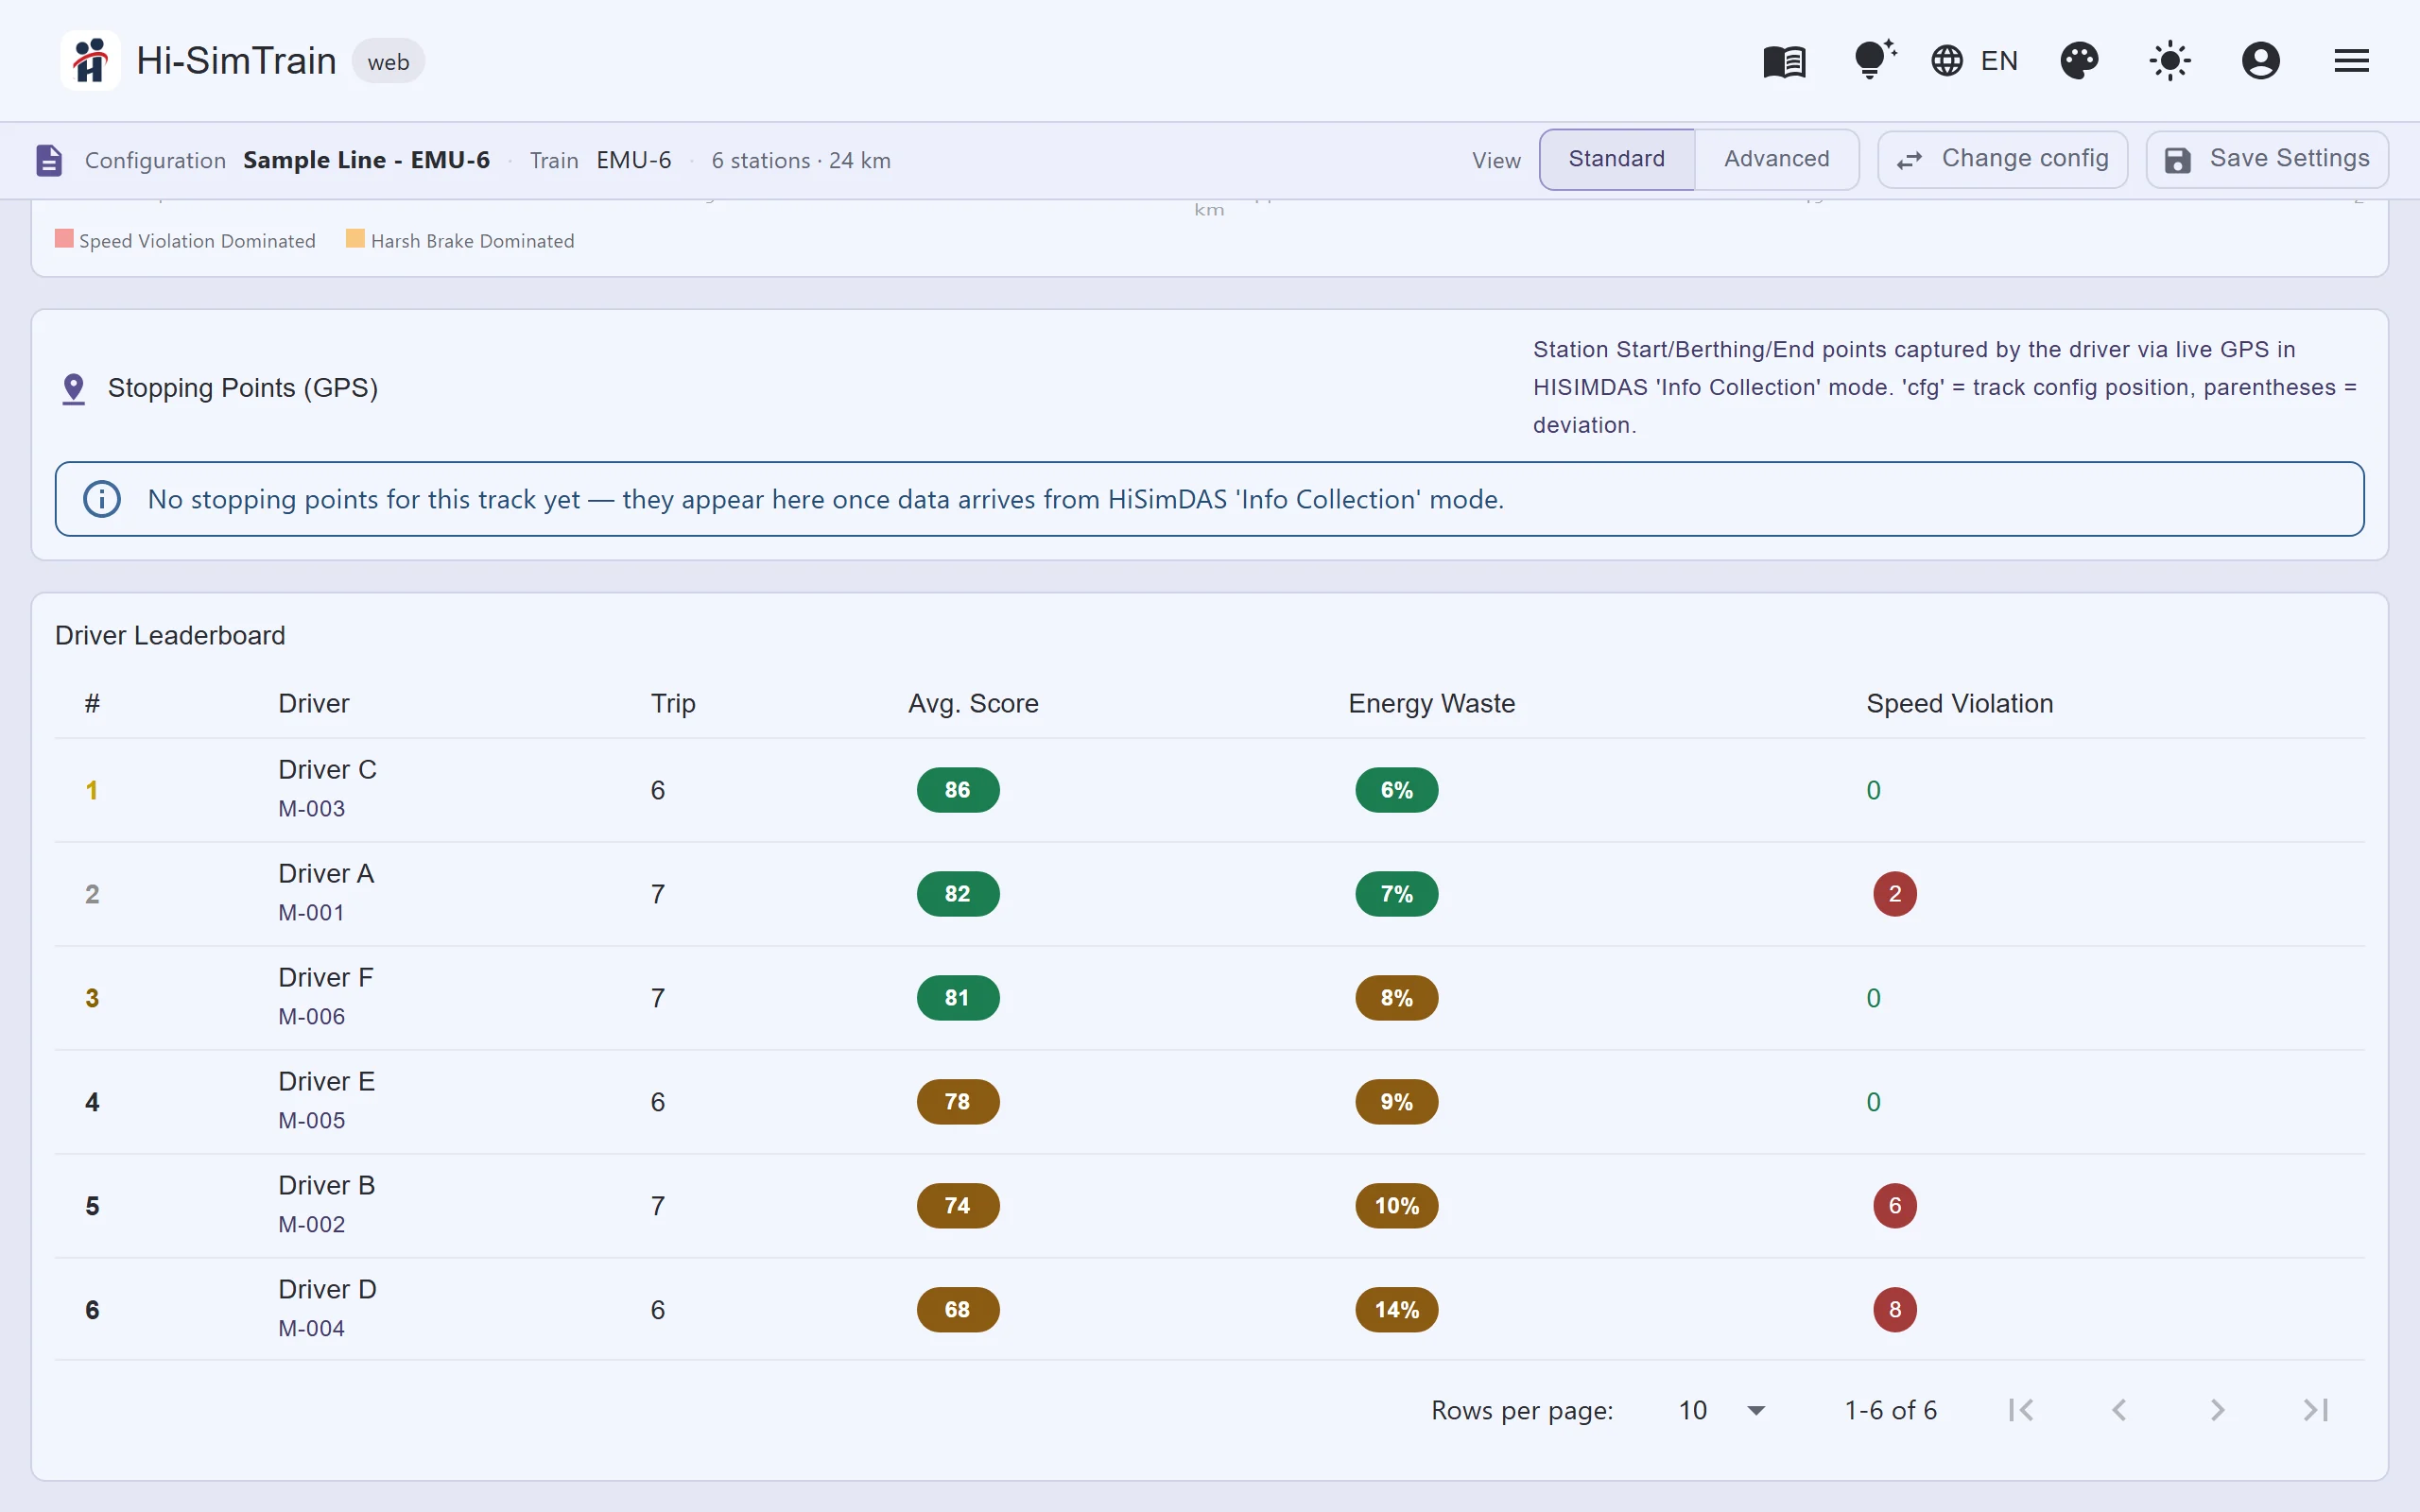
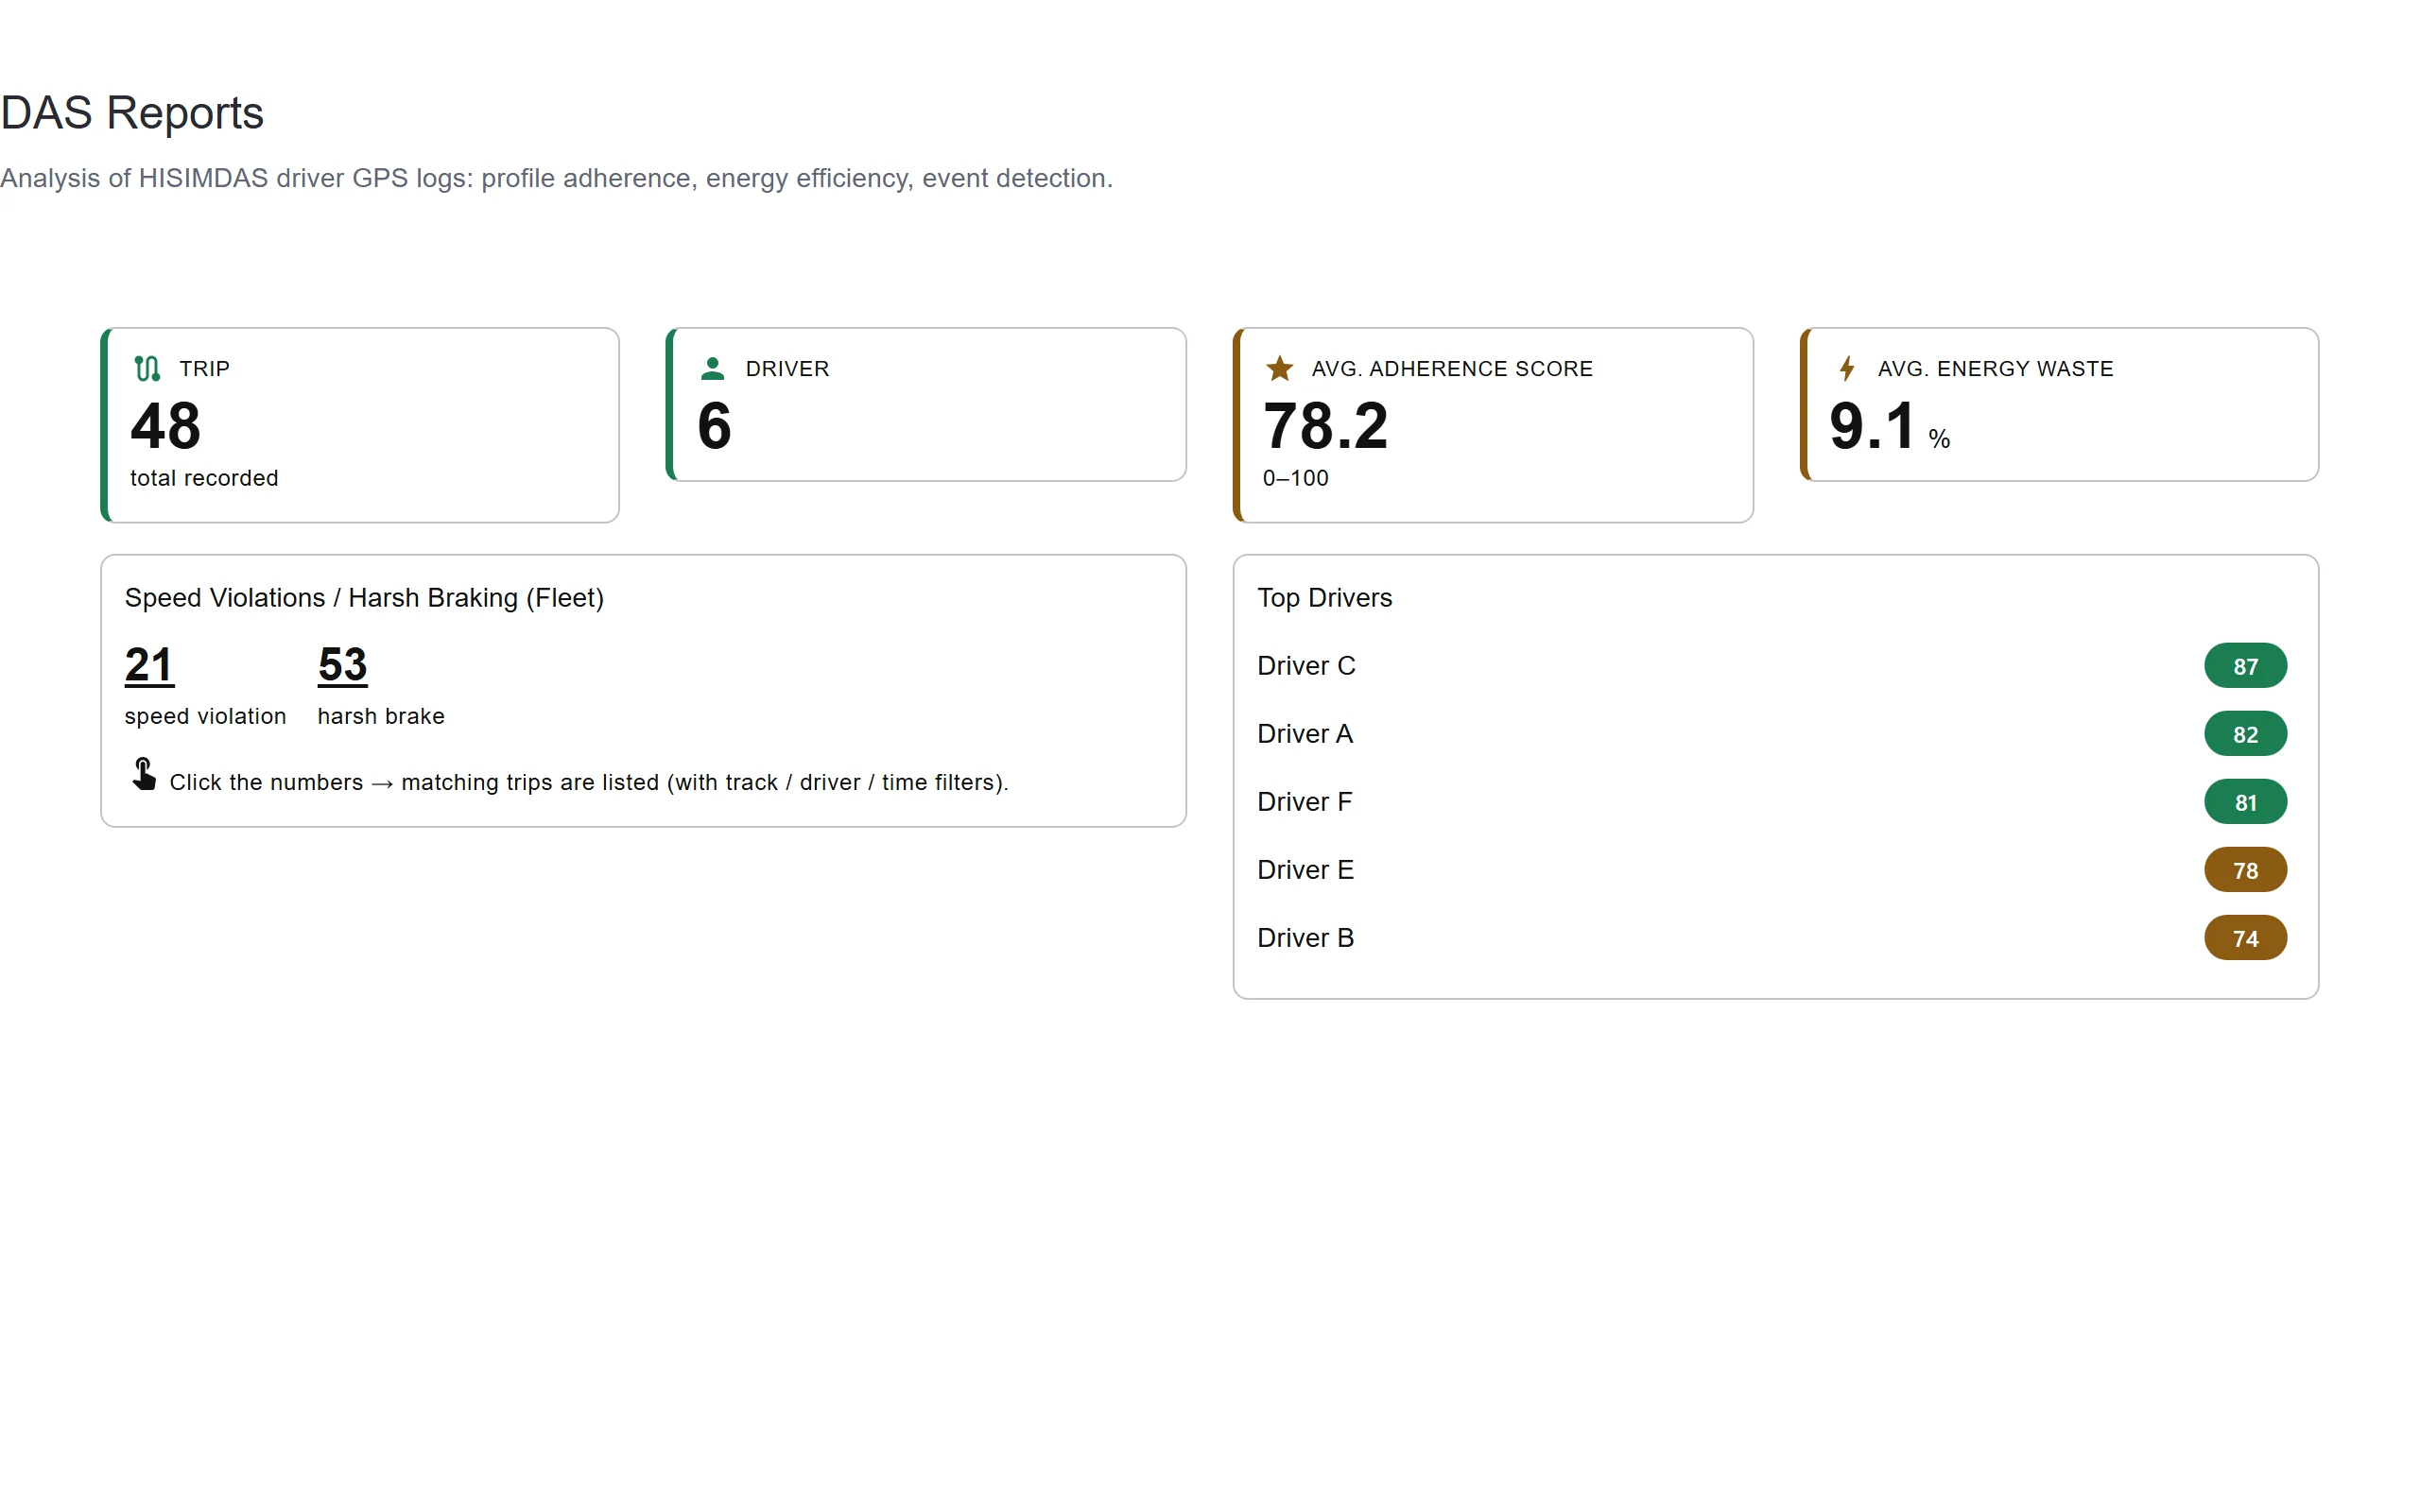
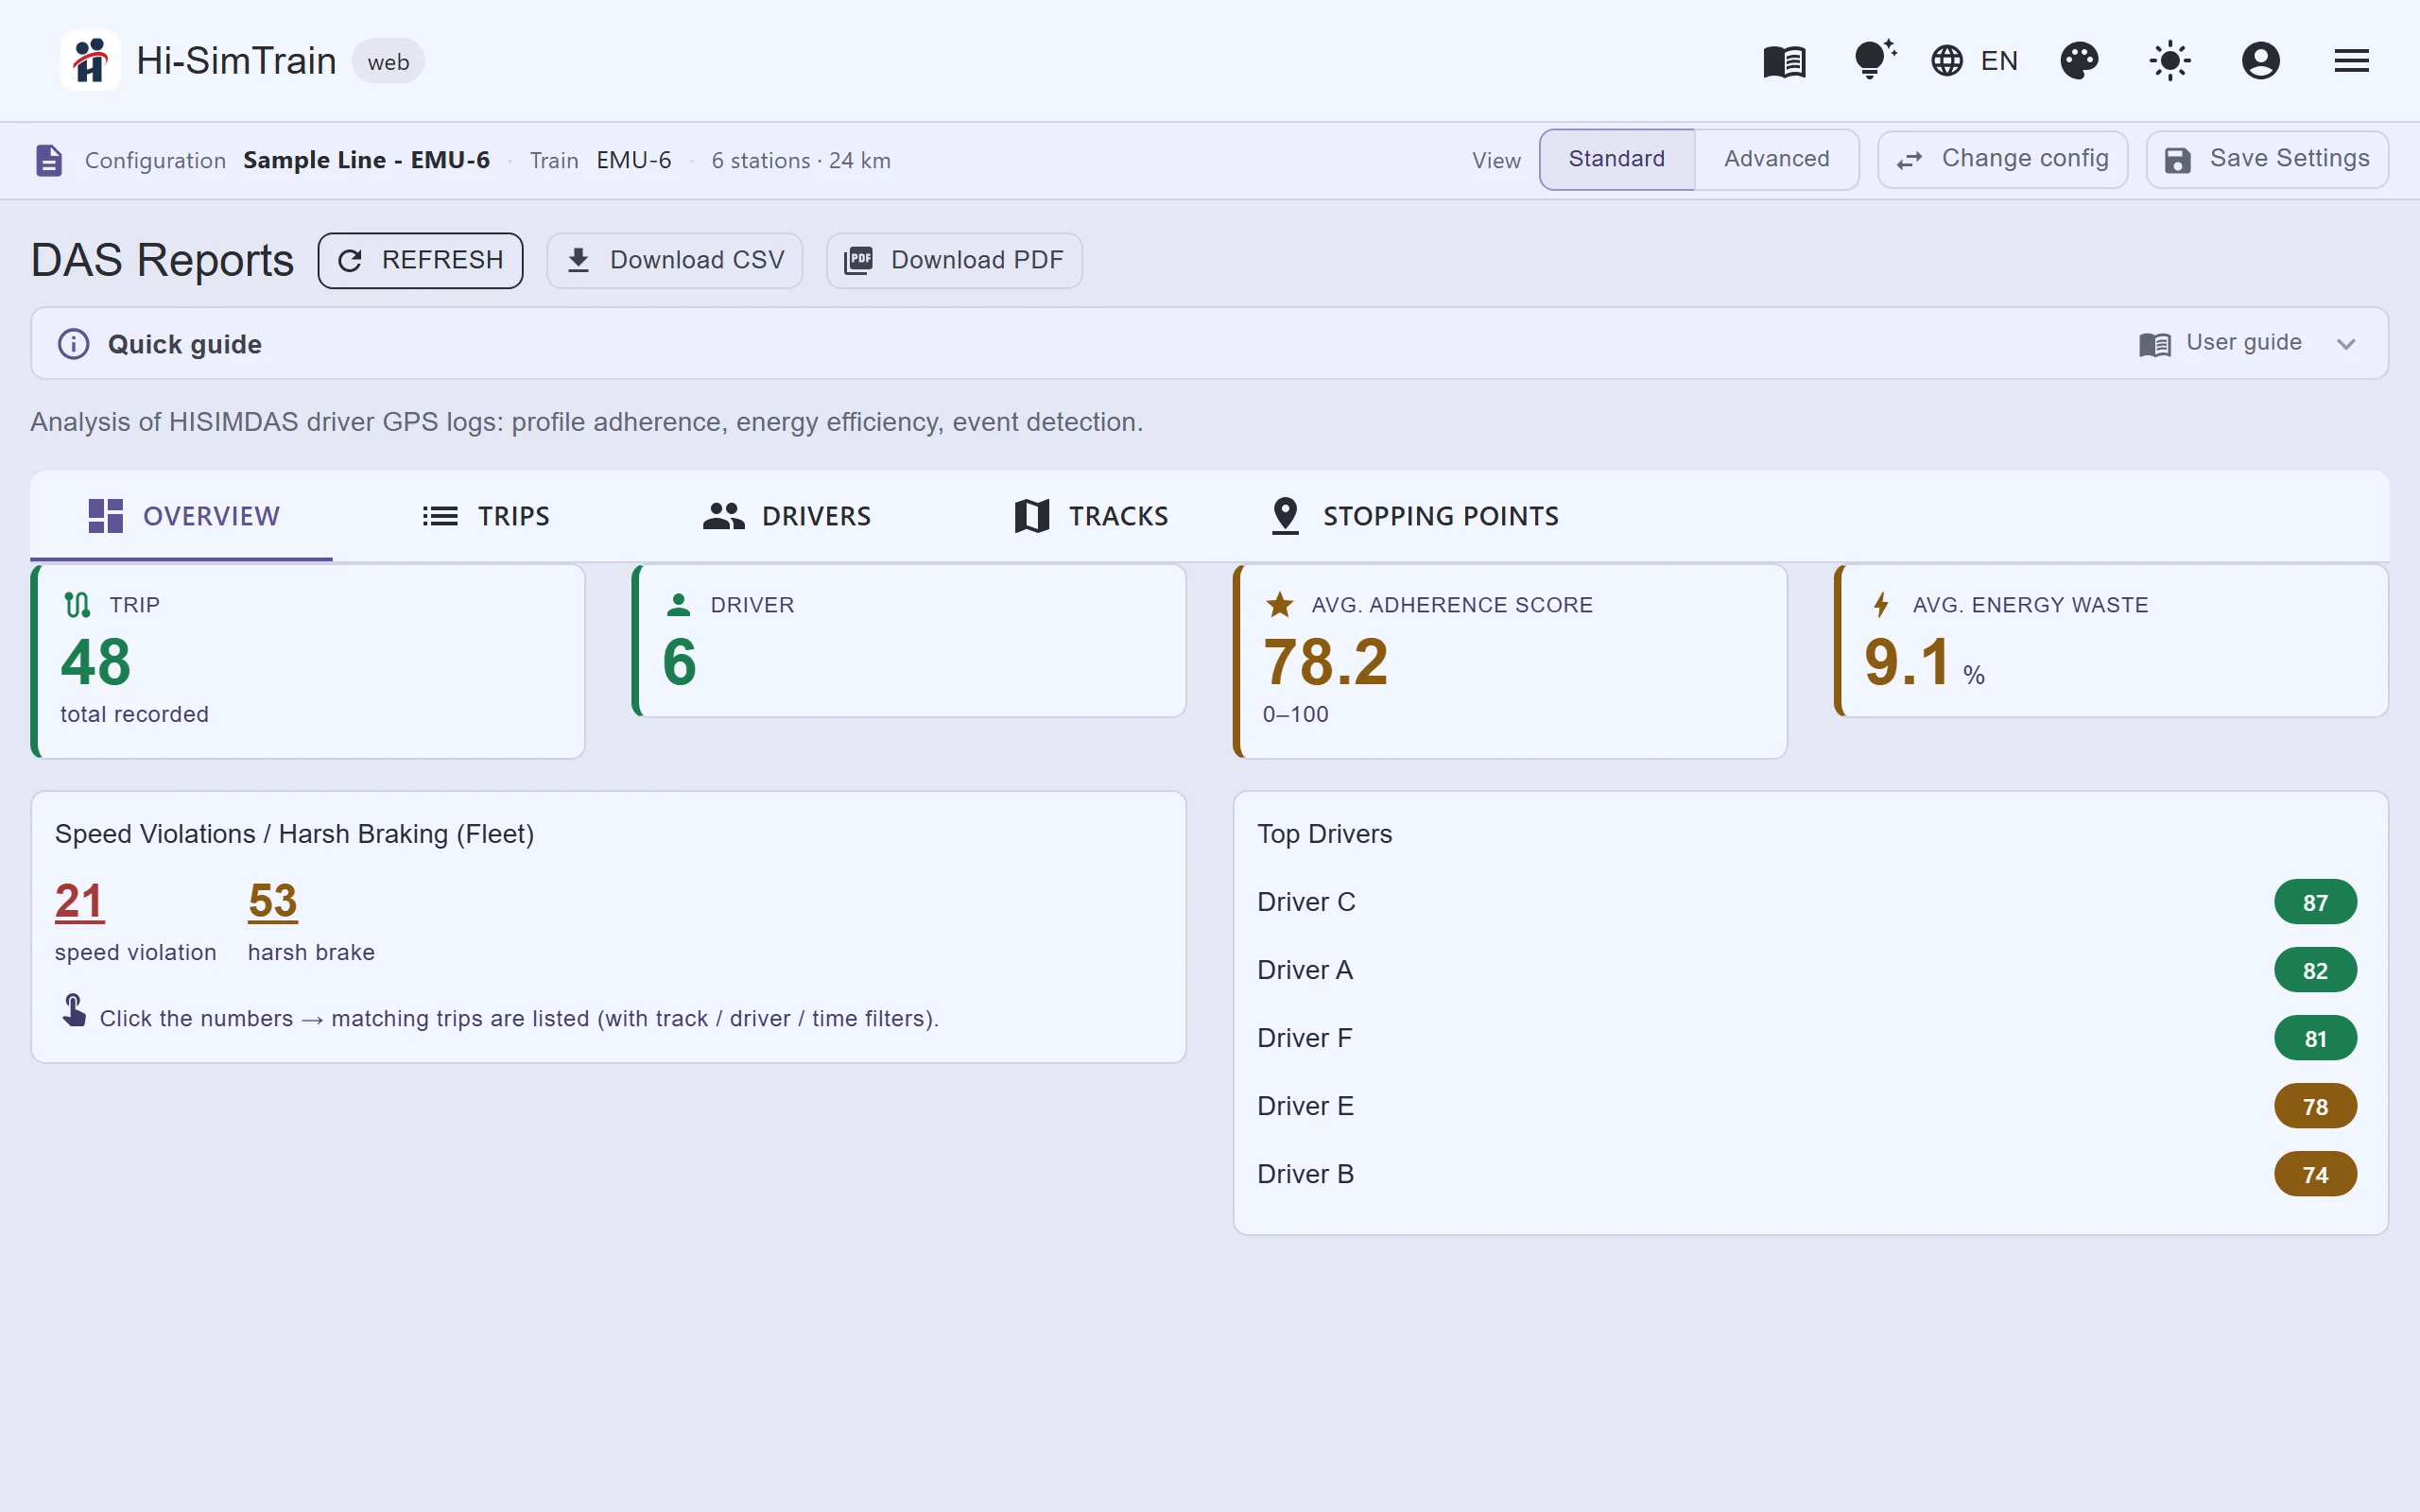
- Overview: Total trips and drivers, average adherence score, average energy waste, fleet-wide speeding and harsh braking counts, best drivers. Clicking a figure lists the trips behind it.
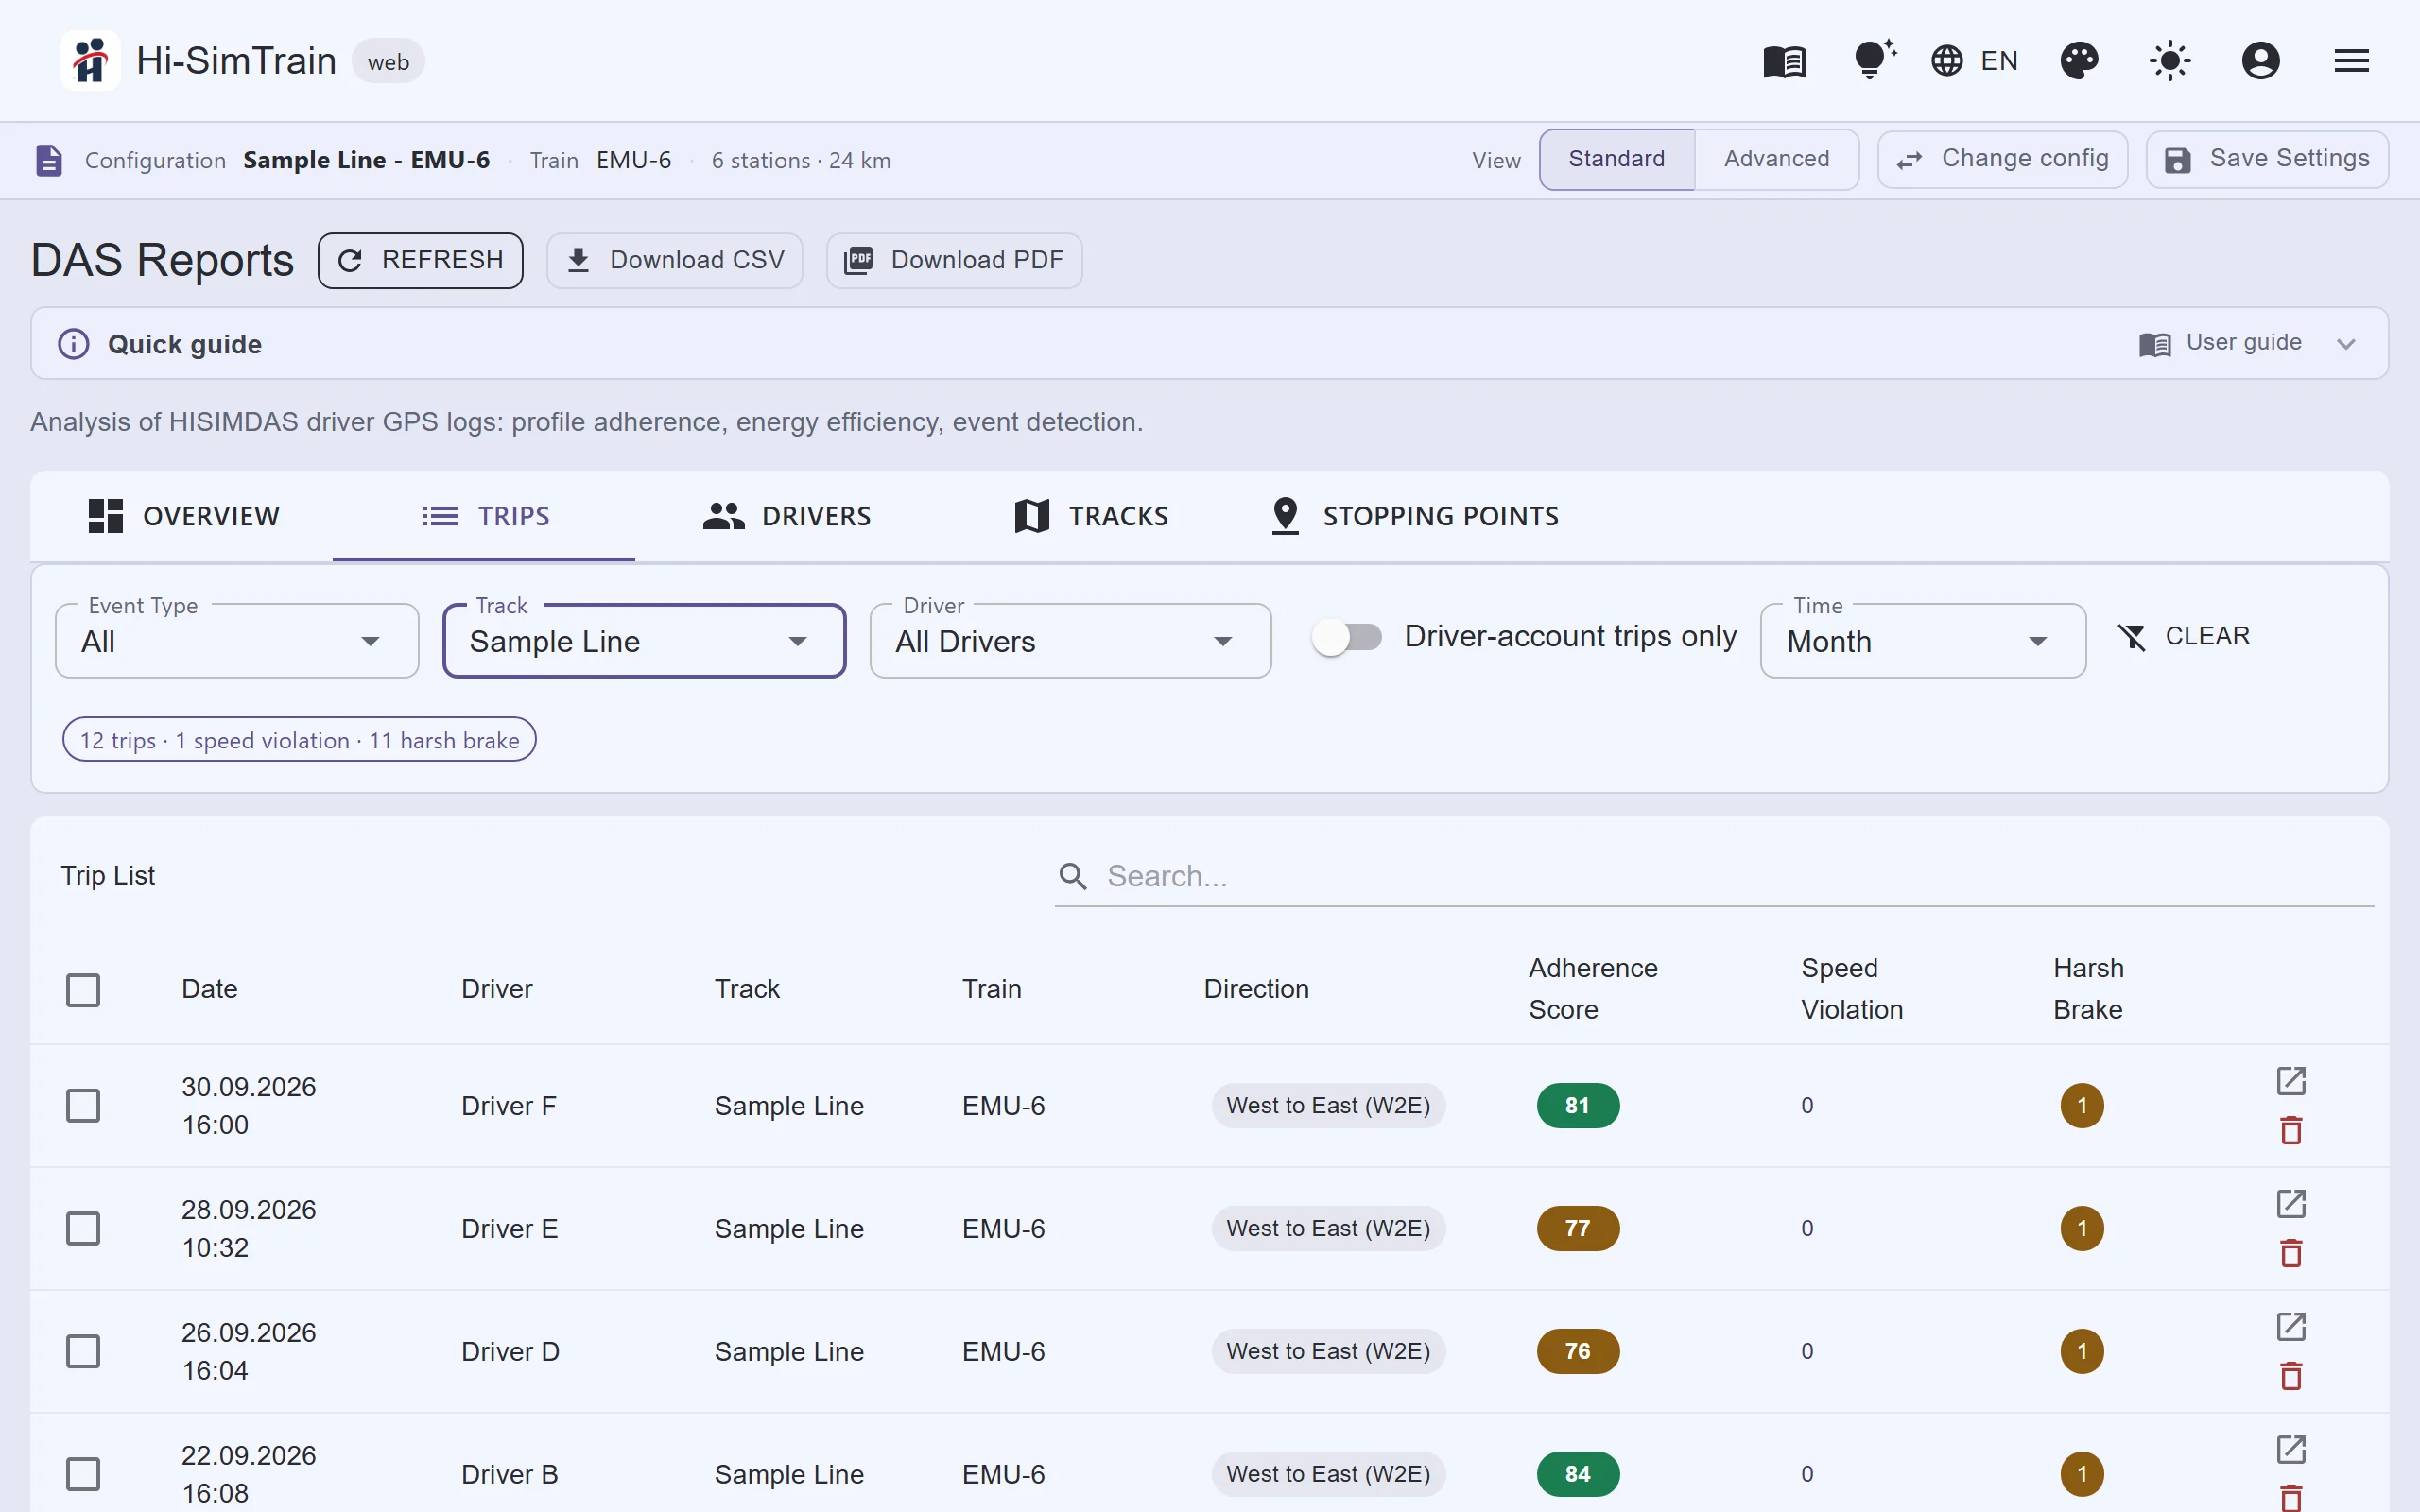
- Trips: Filterable, searchable trip list with date, driver, line, train, direction, adherence score and speeding.
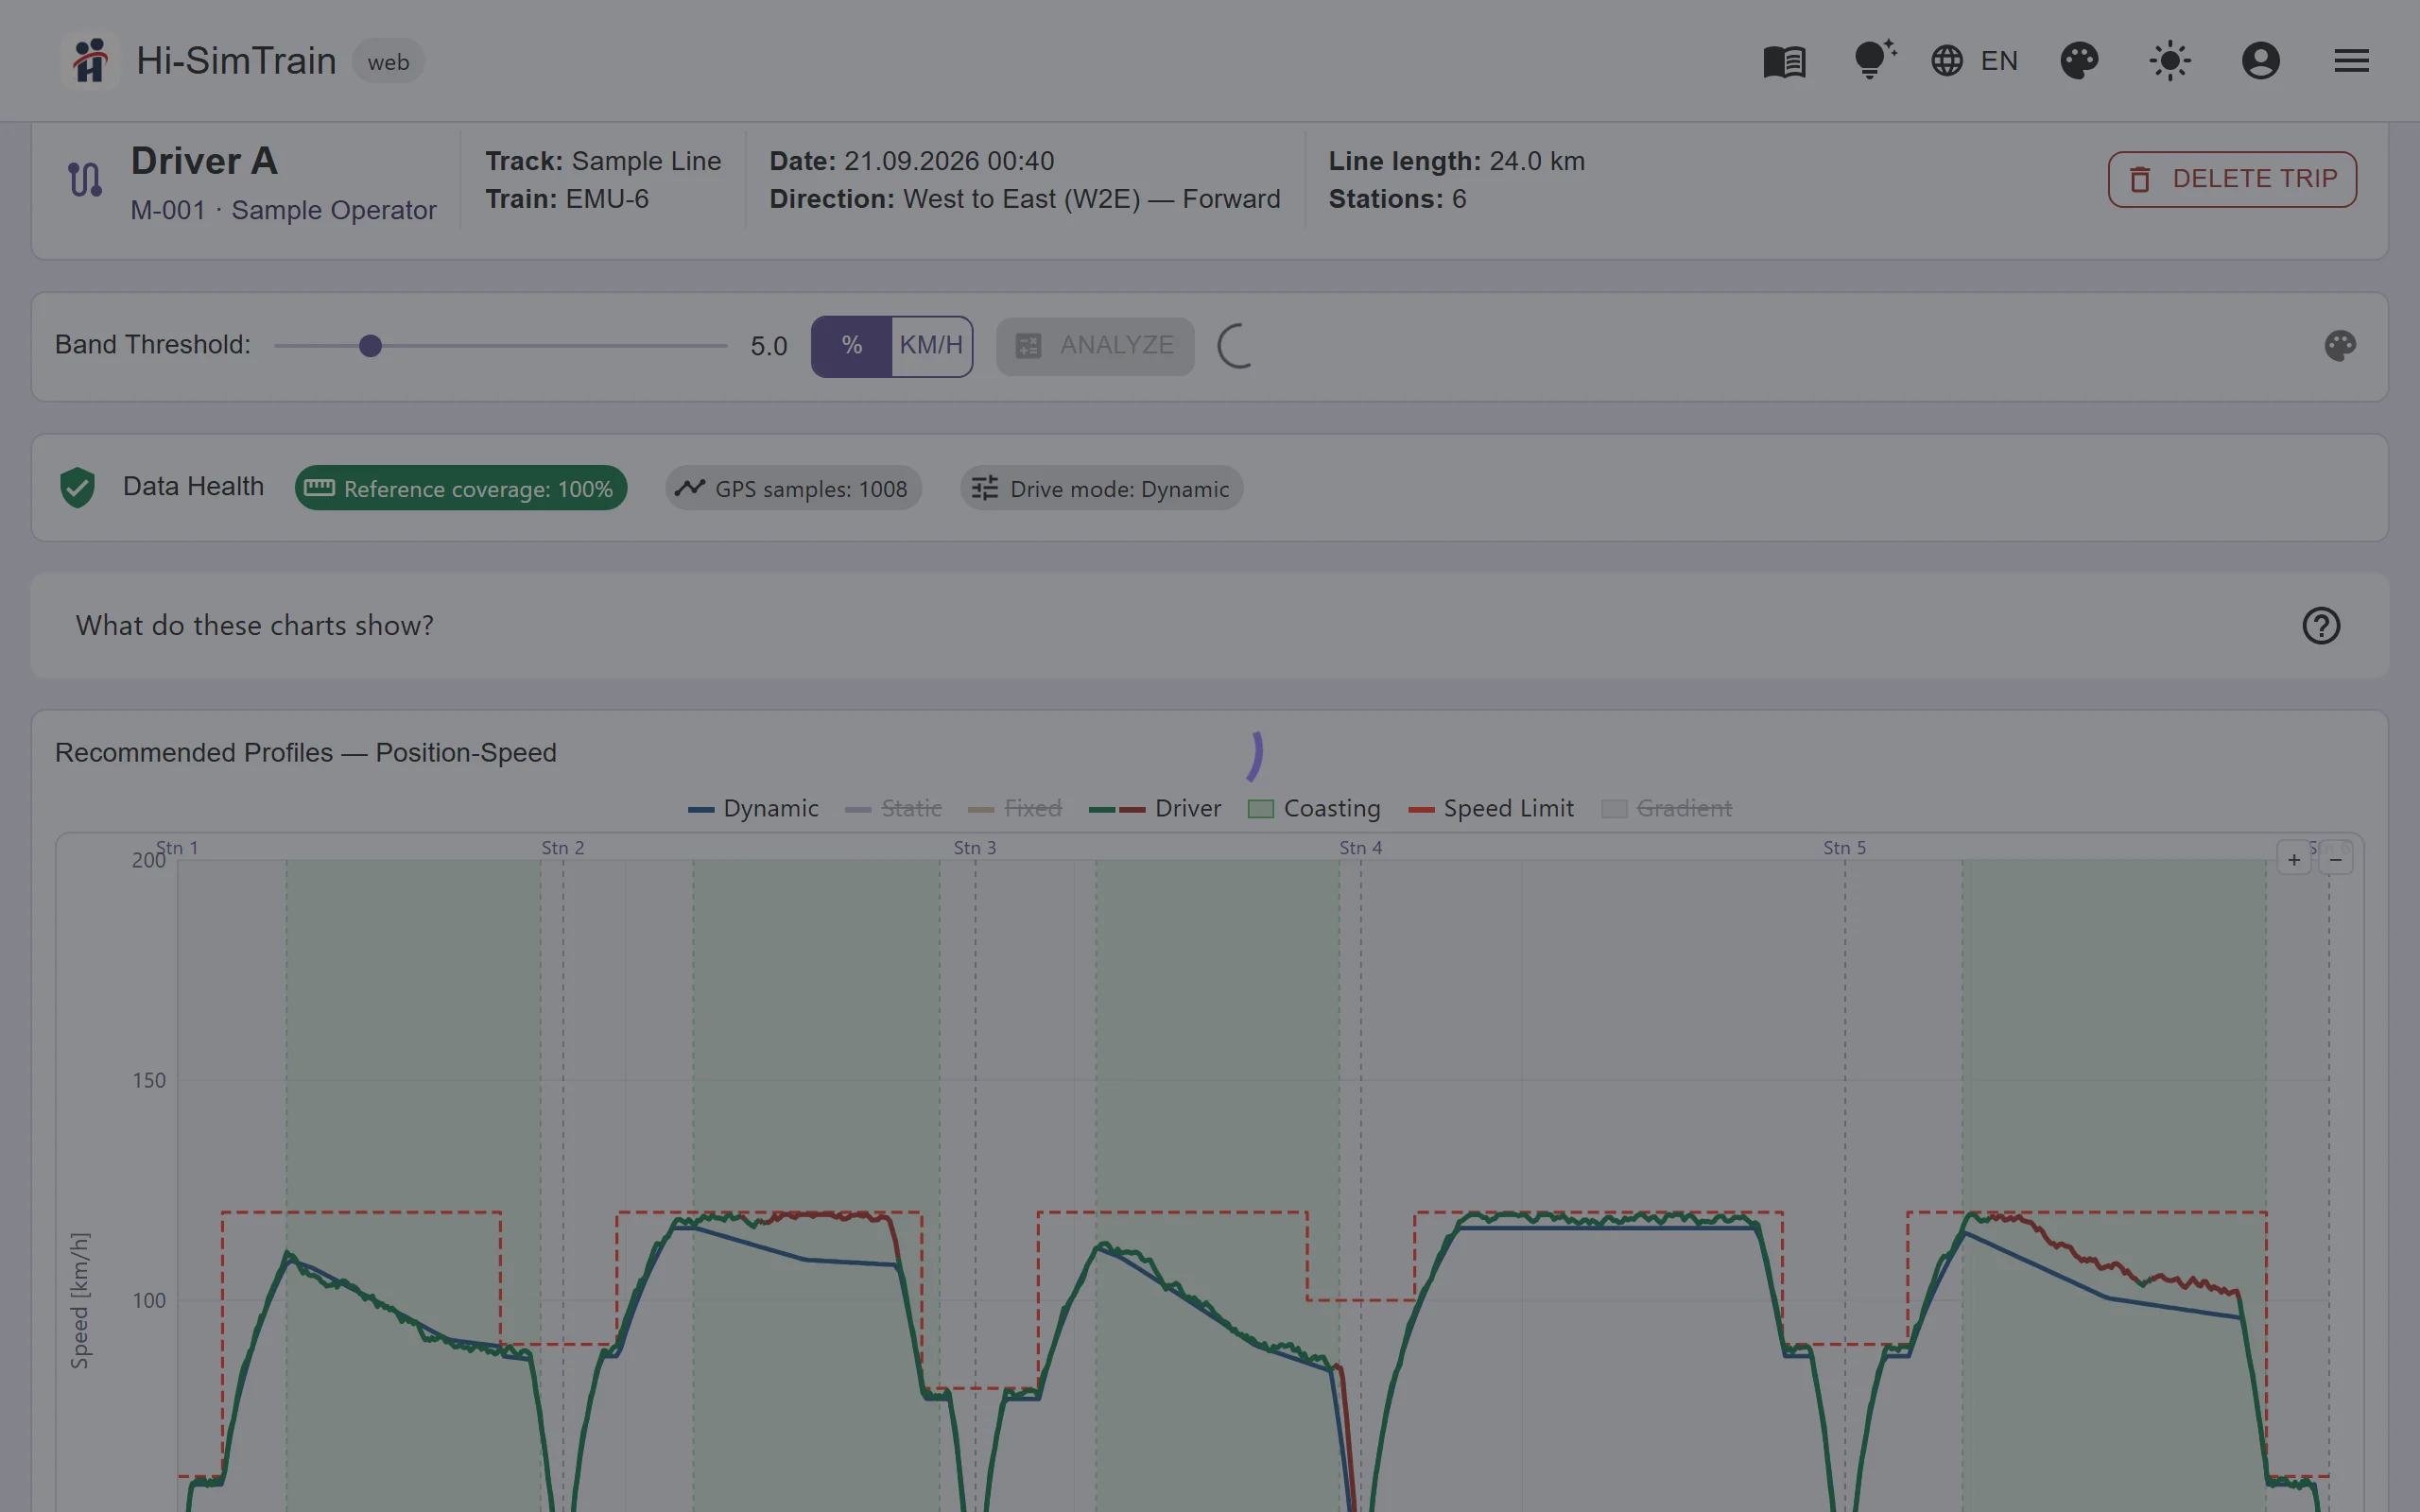
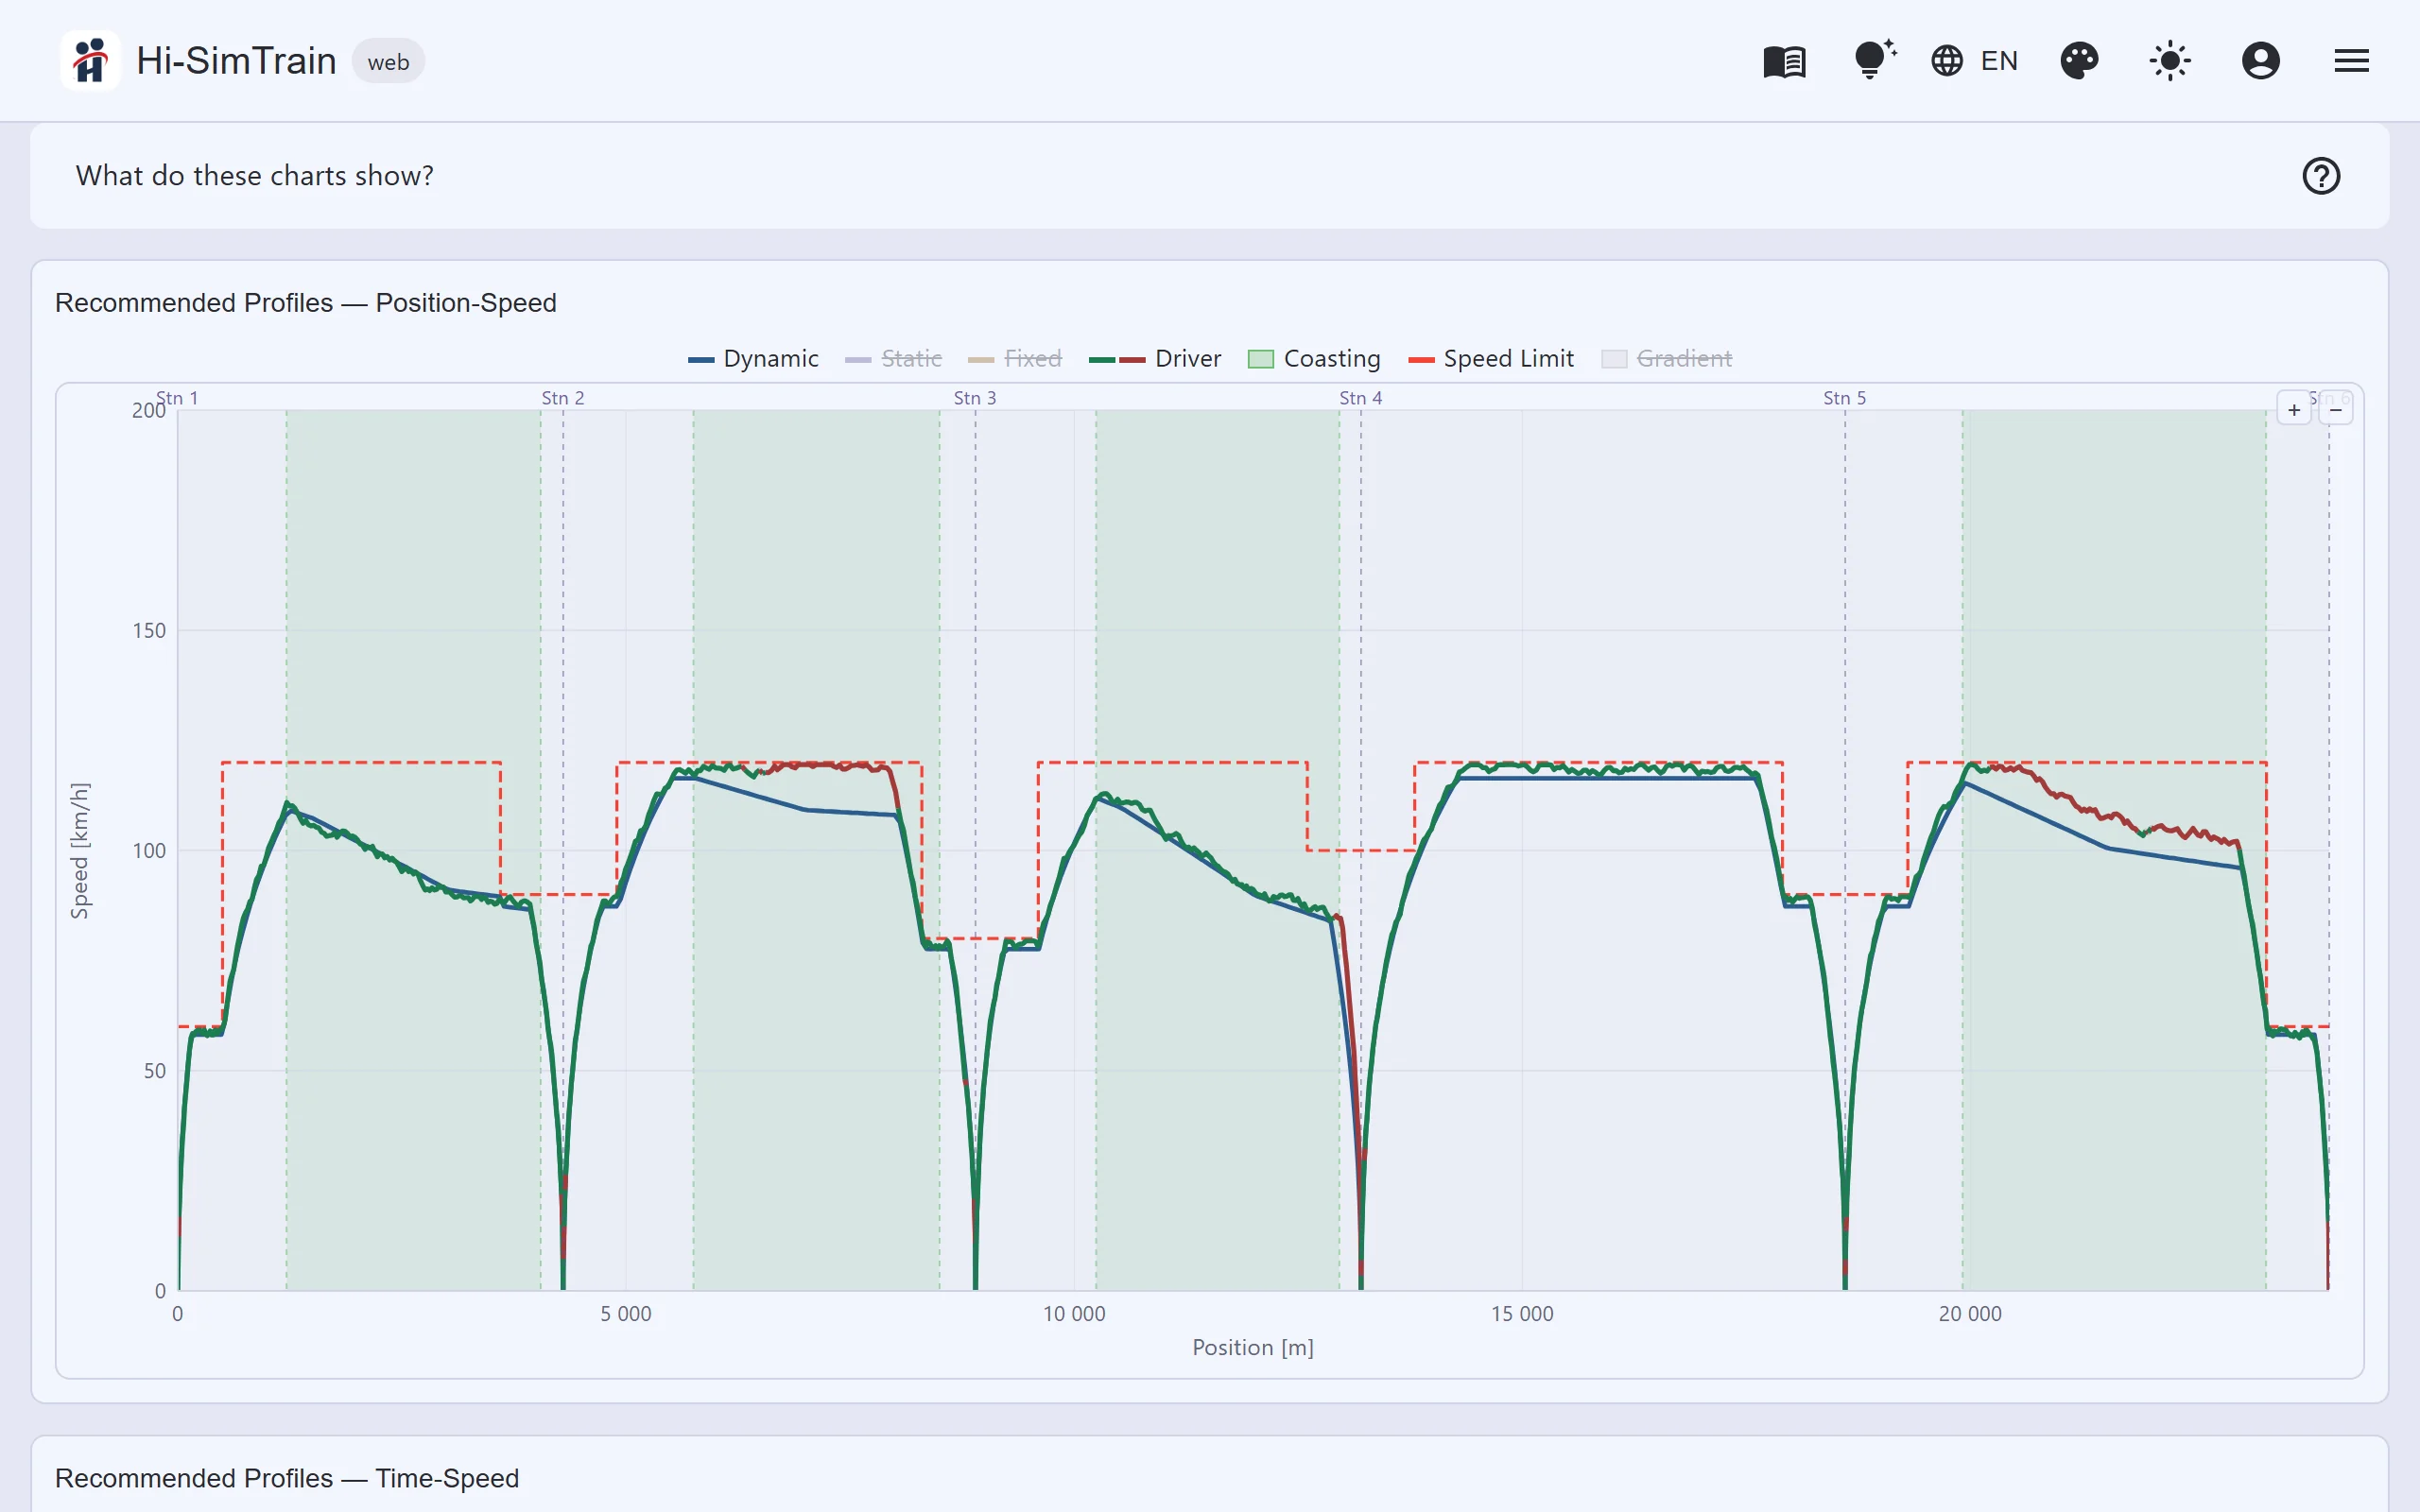
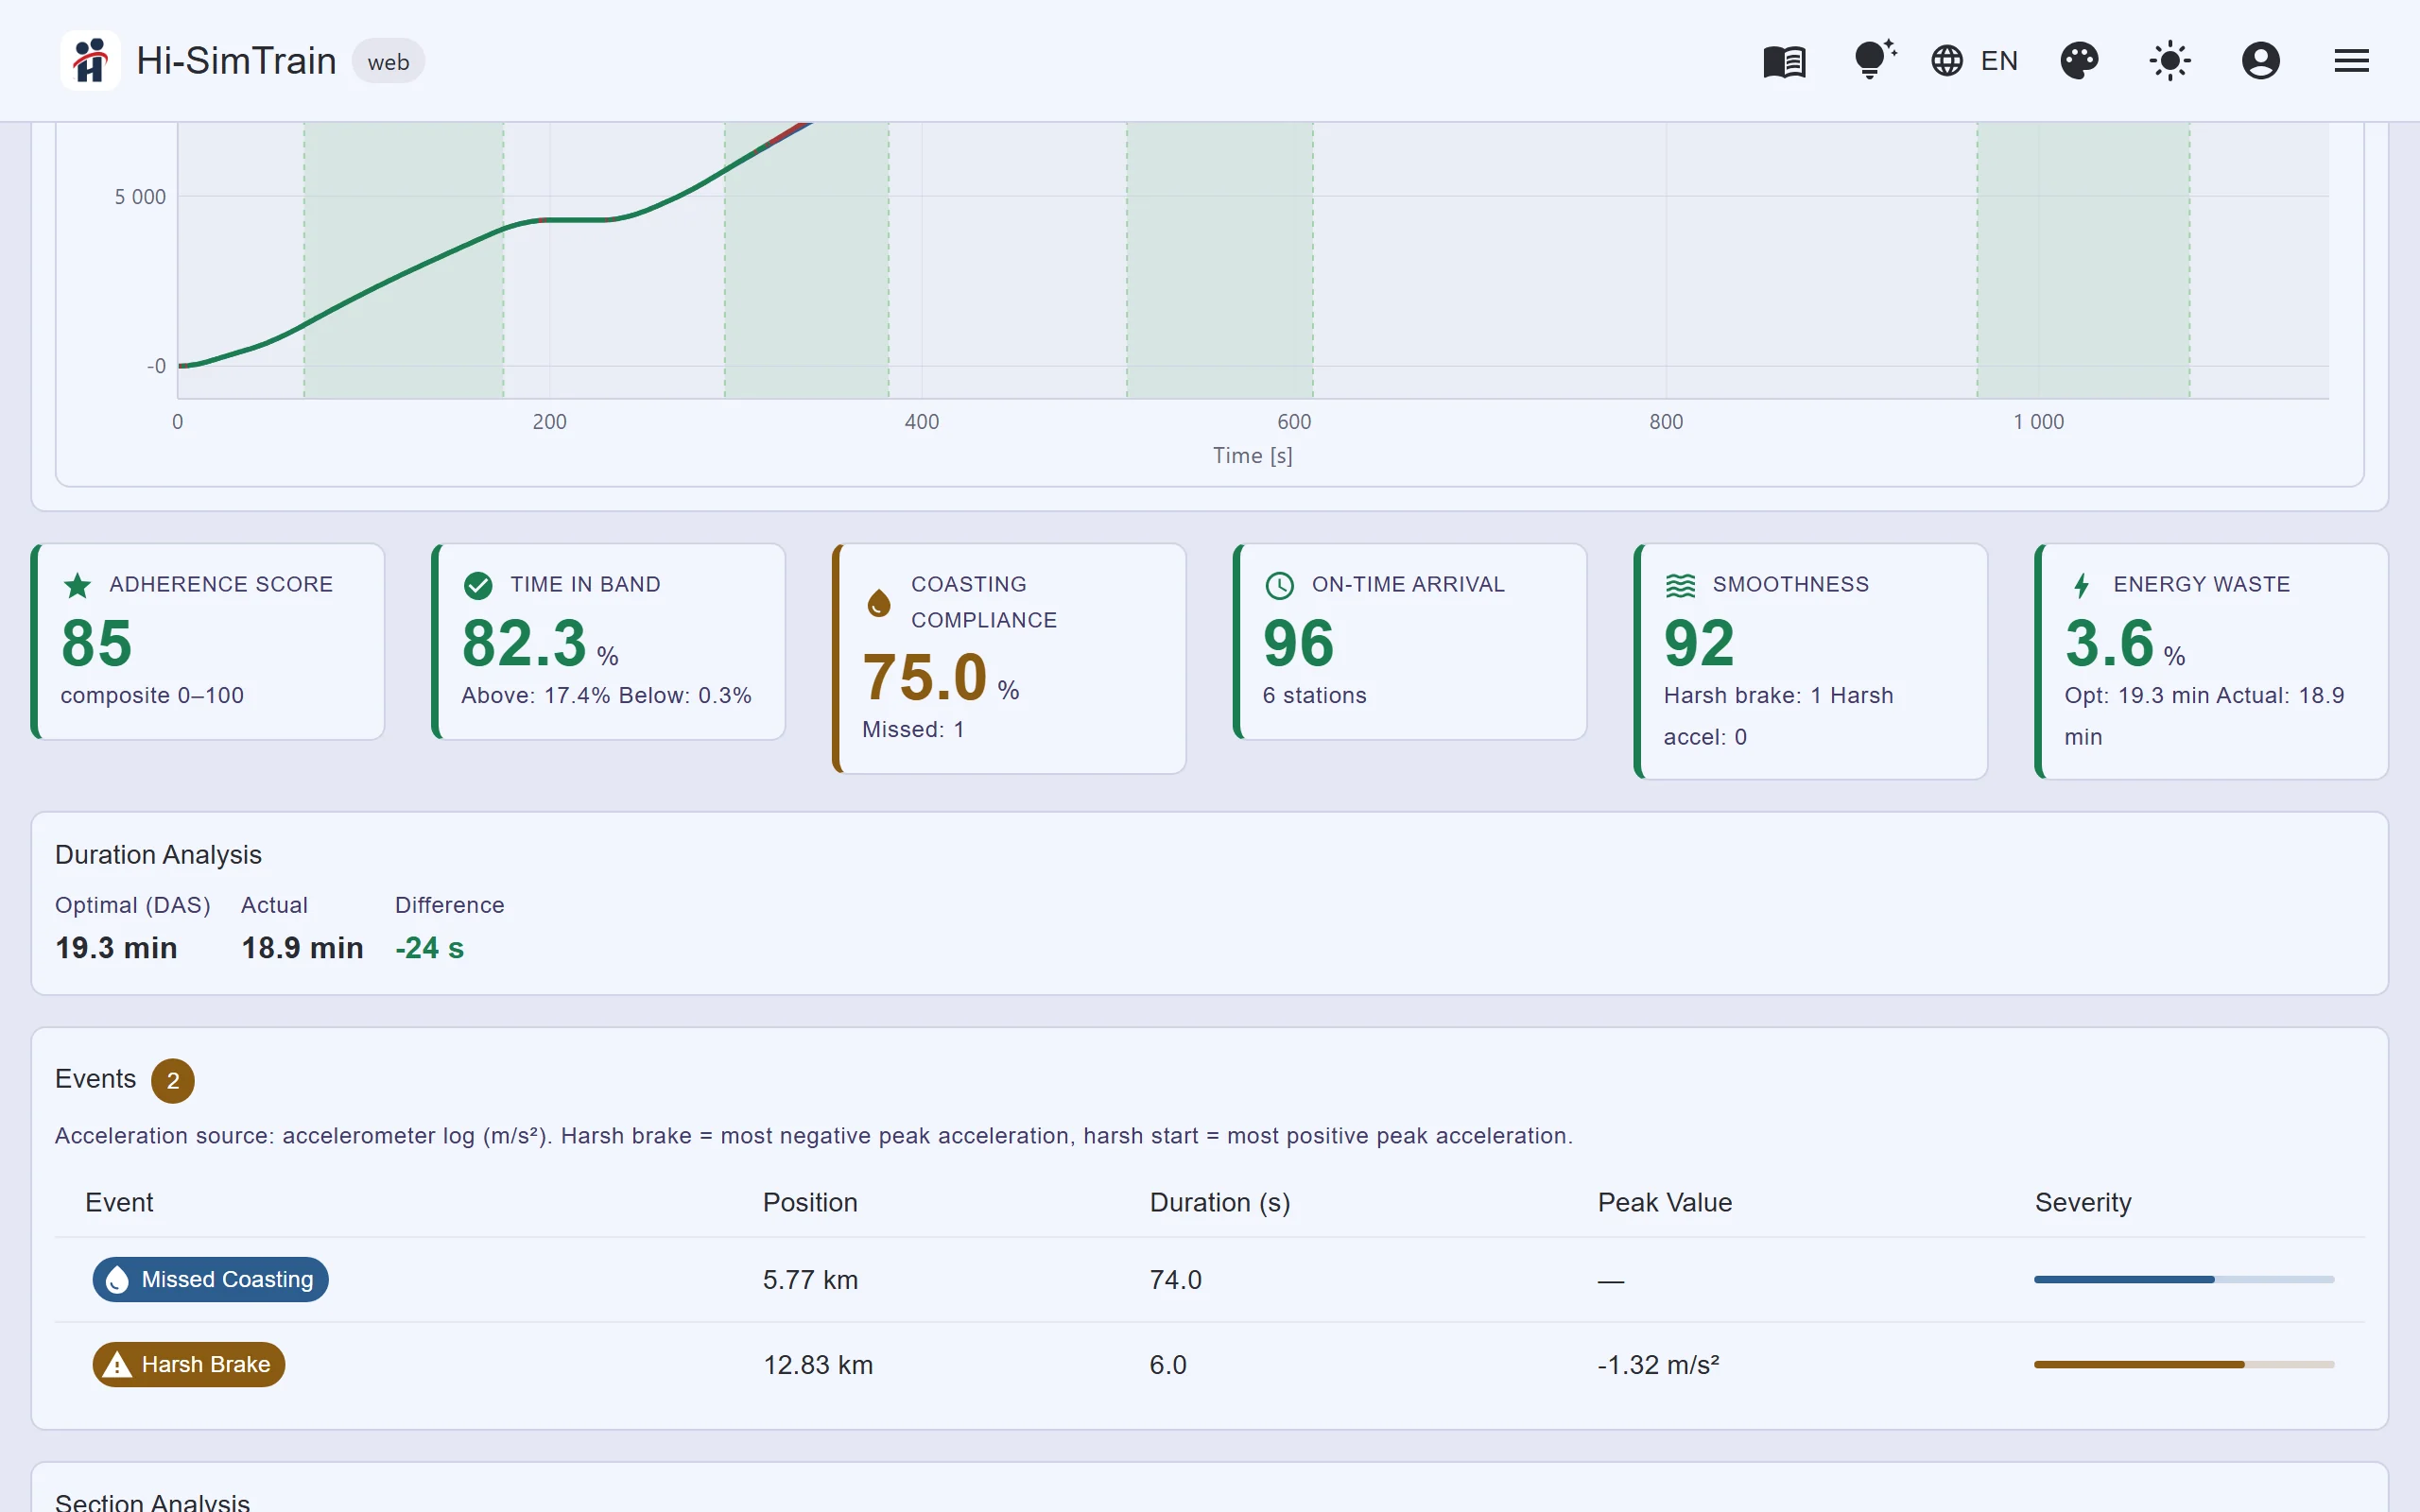
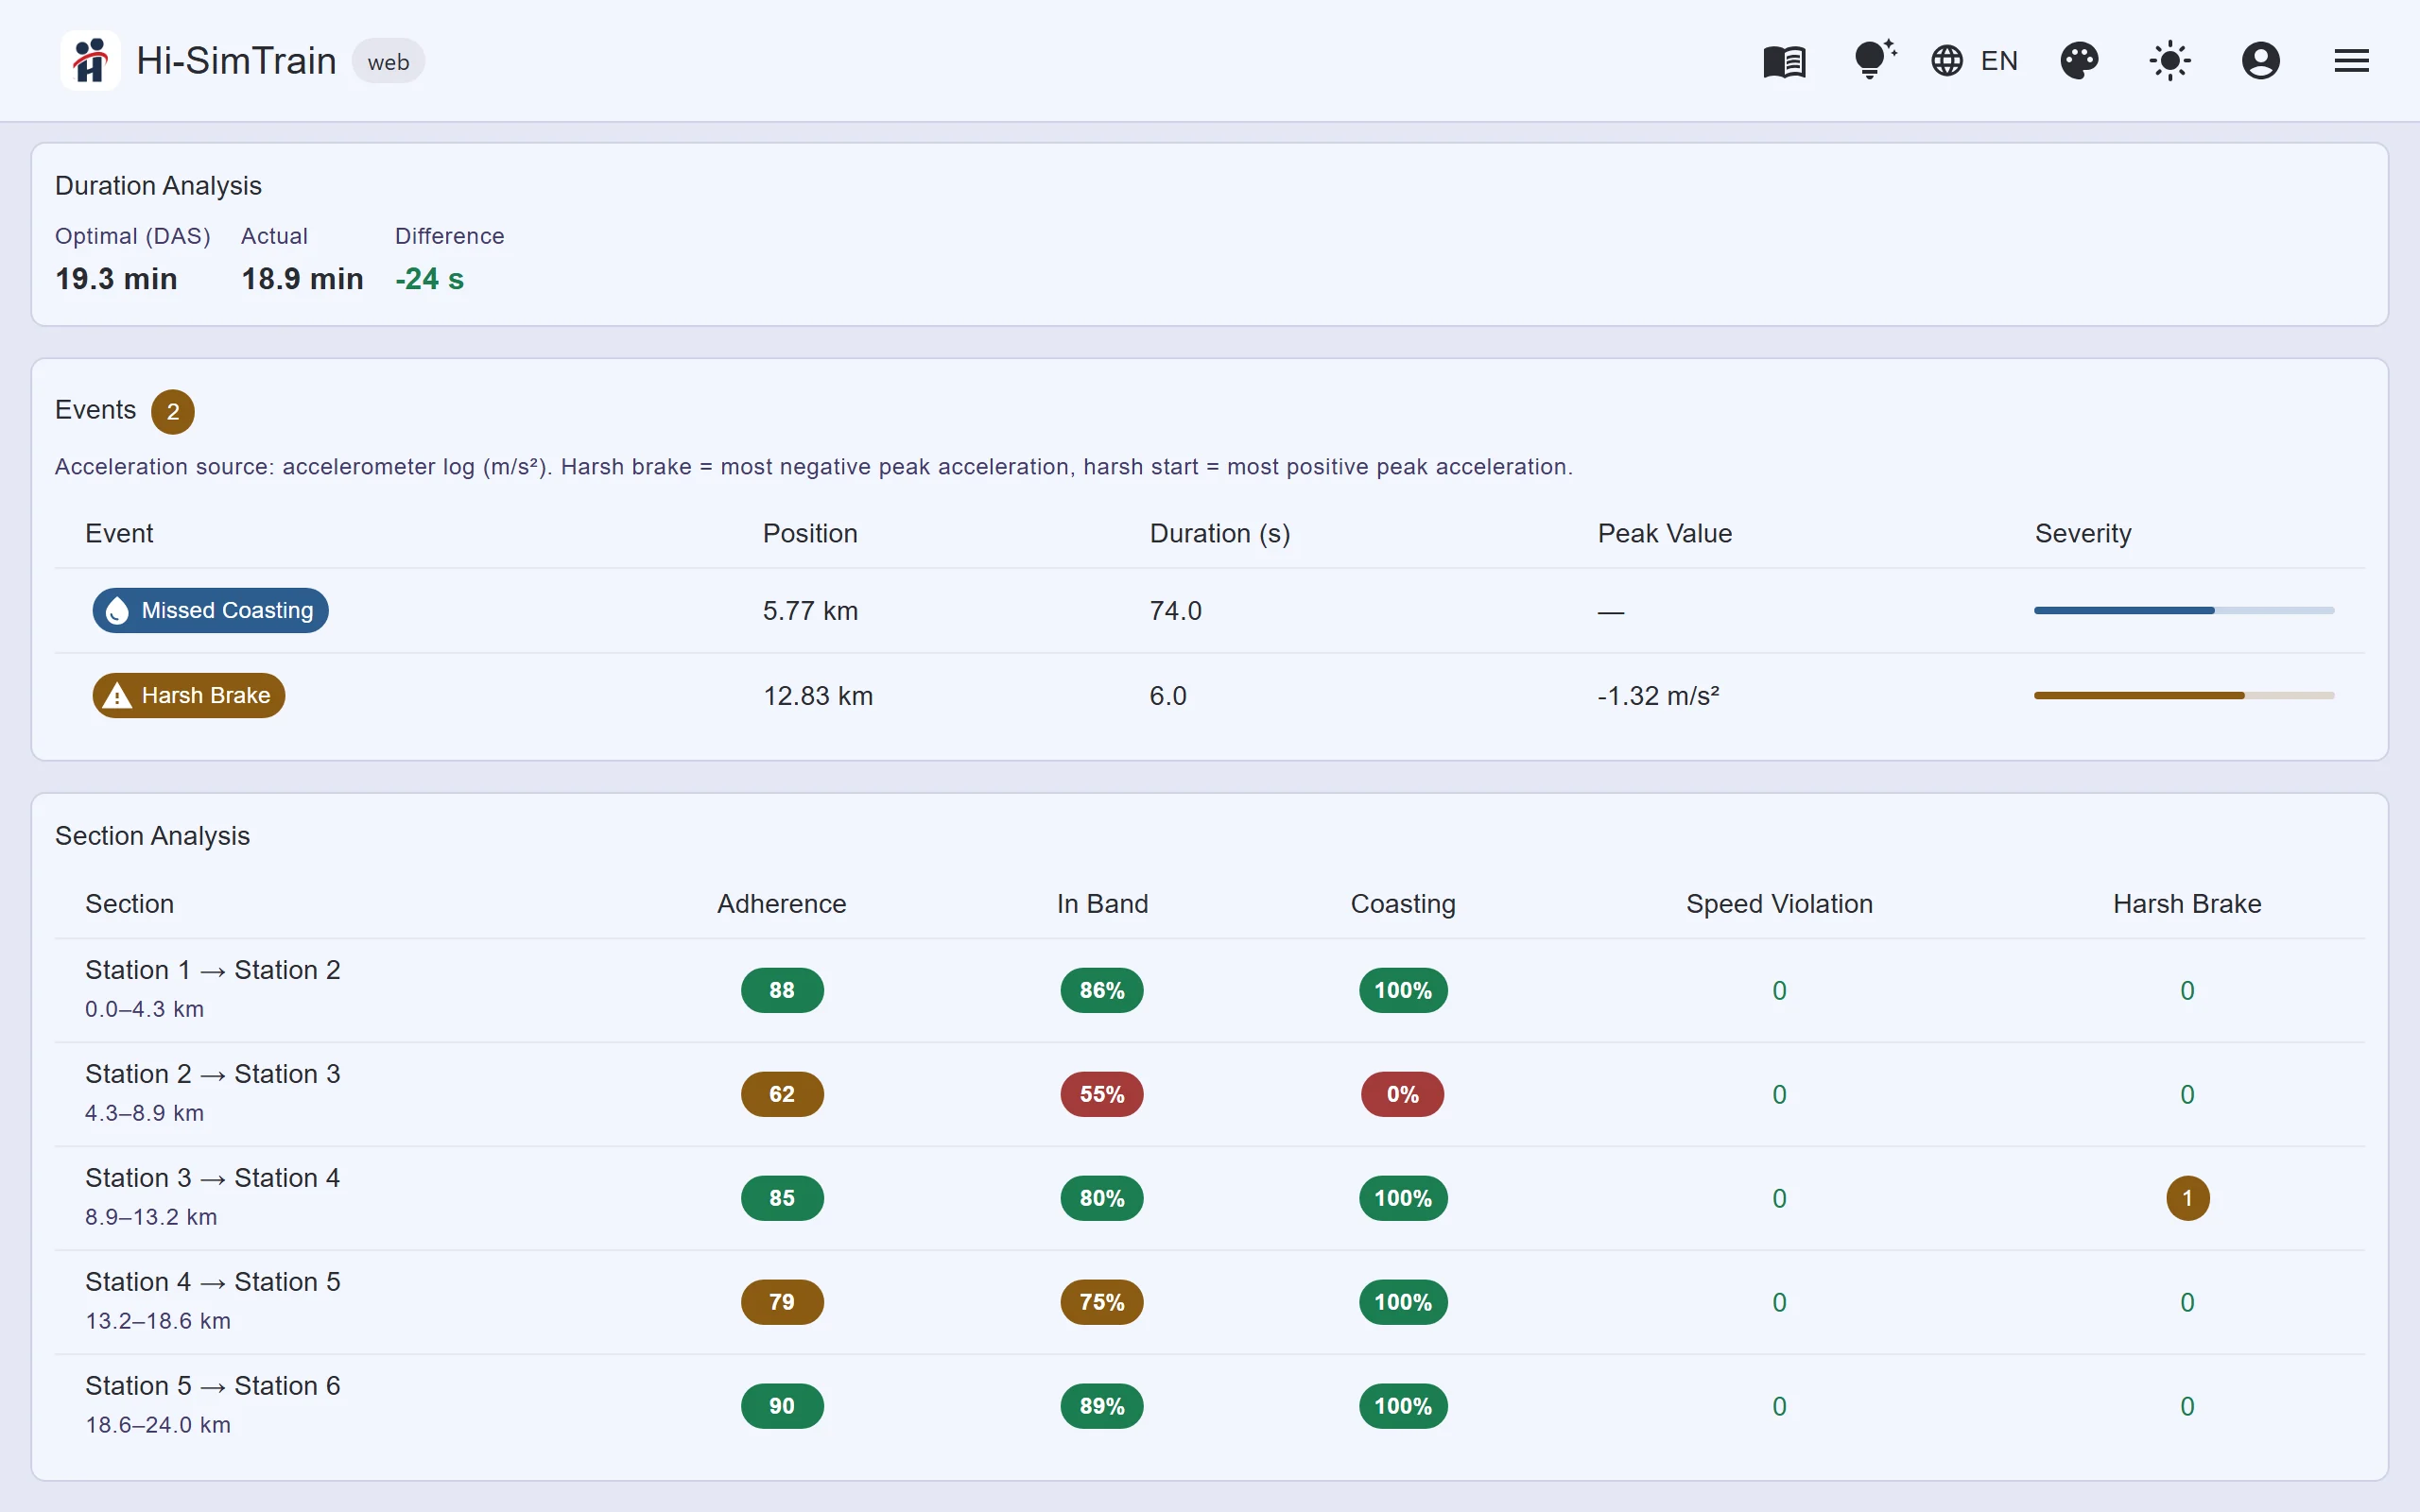
- Trip detail: Score and its components; position-speed, time-speed and time-position charts showing actual driving and three advisory profiles (the static profile stored for the line, a profile recomputed afterwards with the same time budget, and the dynamic profile calculated live during the trip); in-band stretches in green, out-of-band in red. Section analysis between stations, event list, data health and a note on the acceleration source. The band threshold can be changed and the analysis recalculated.
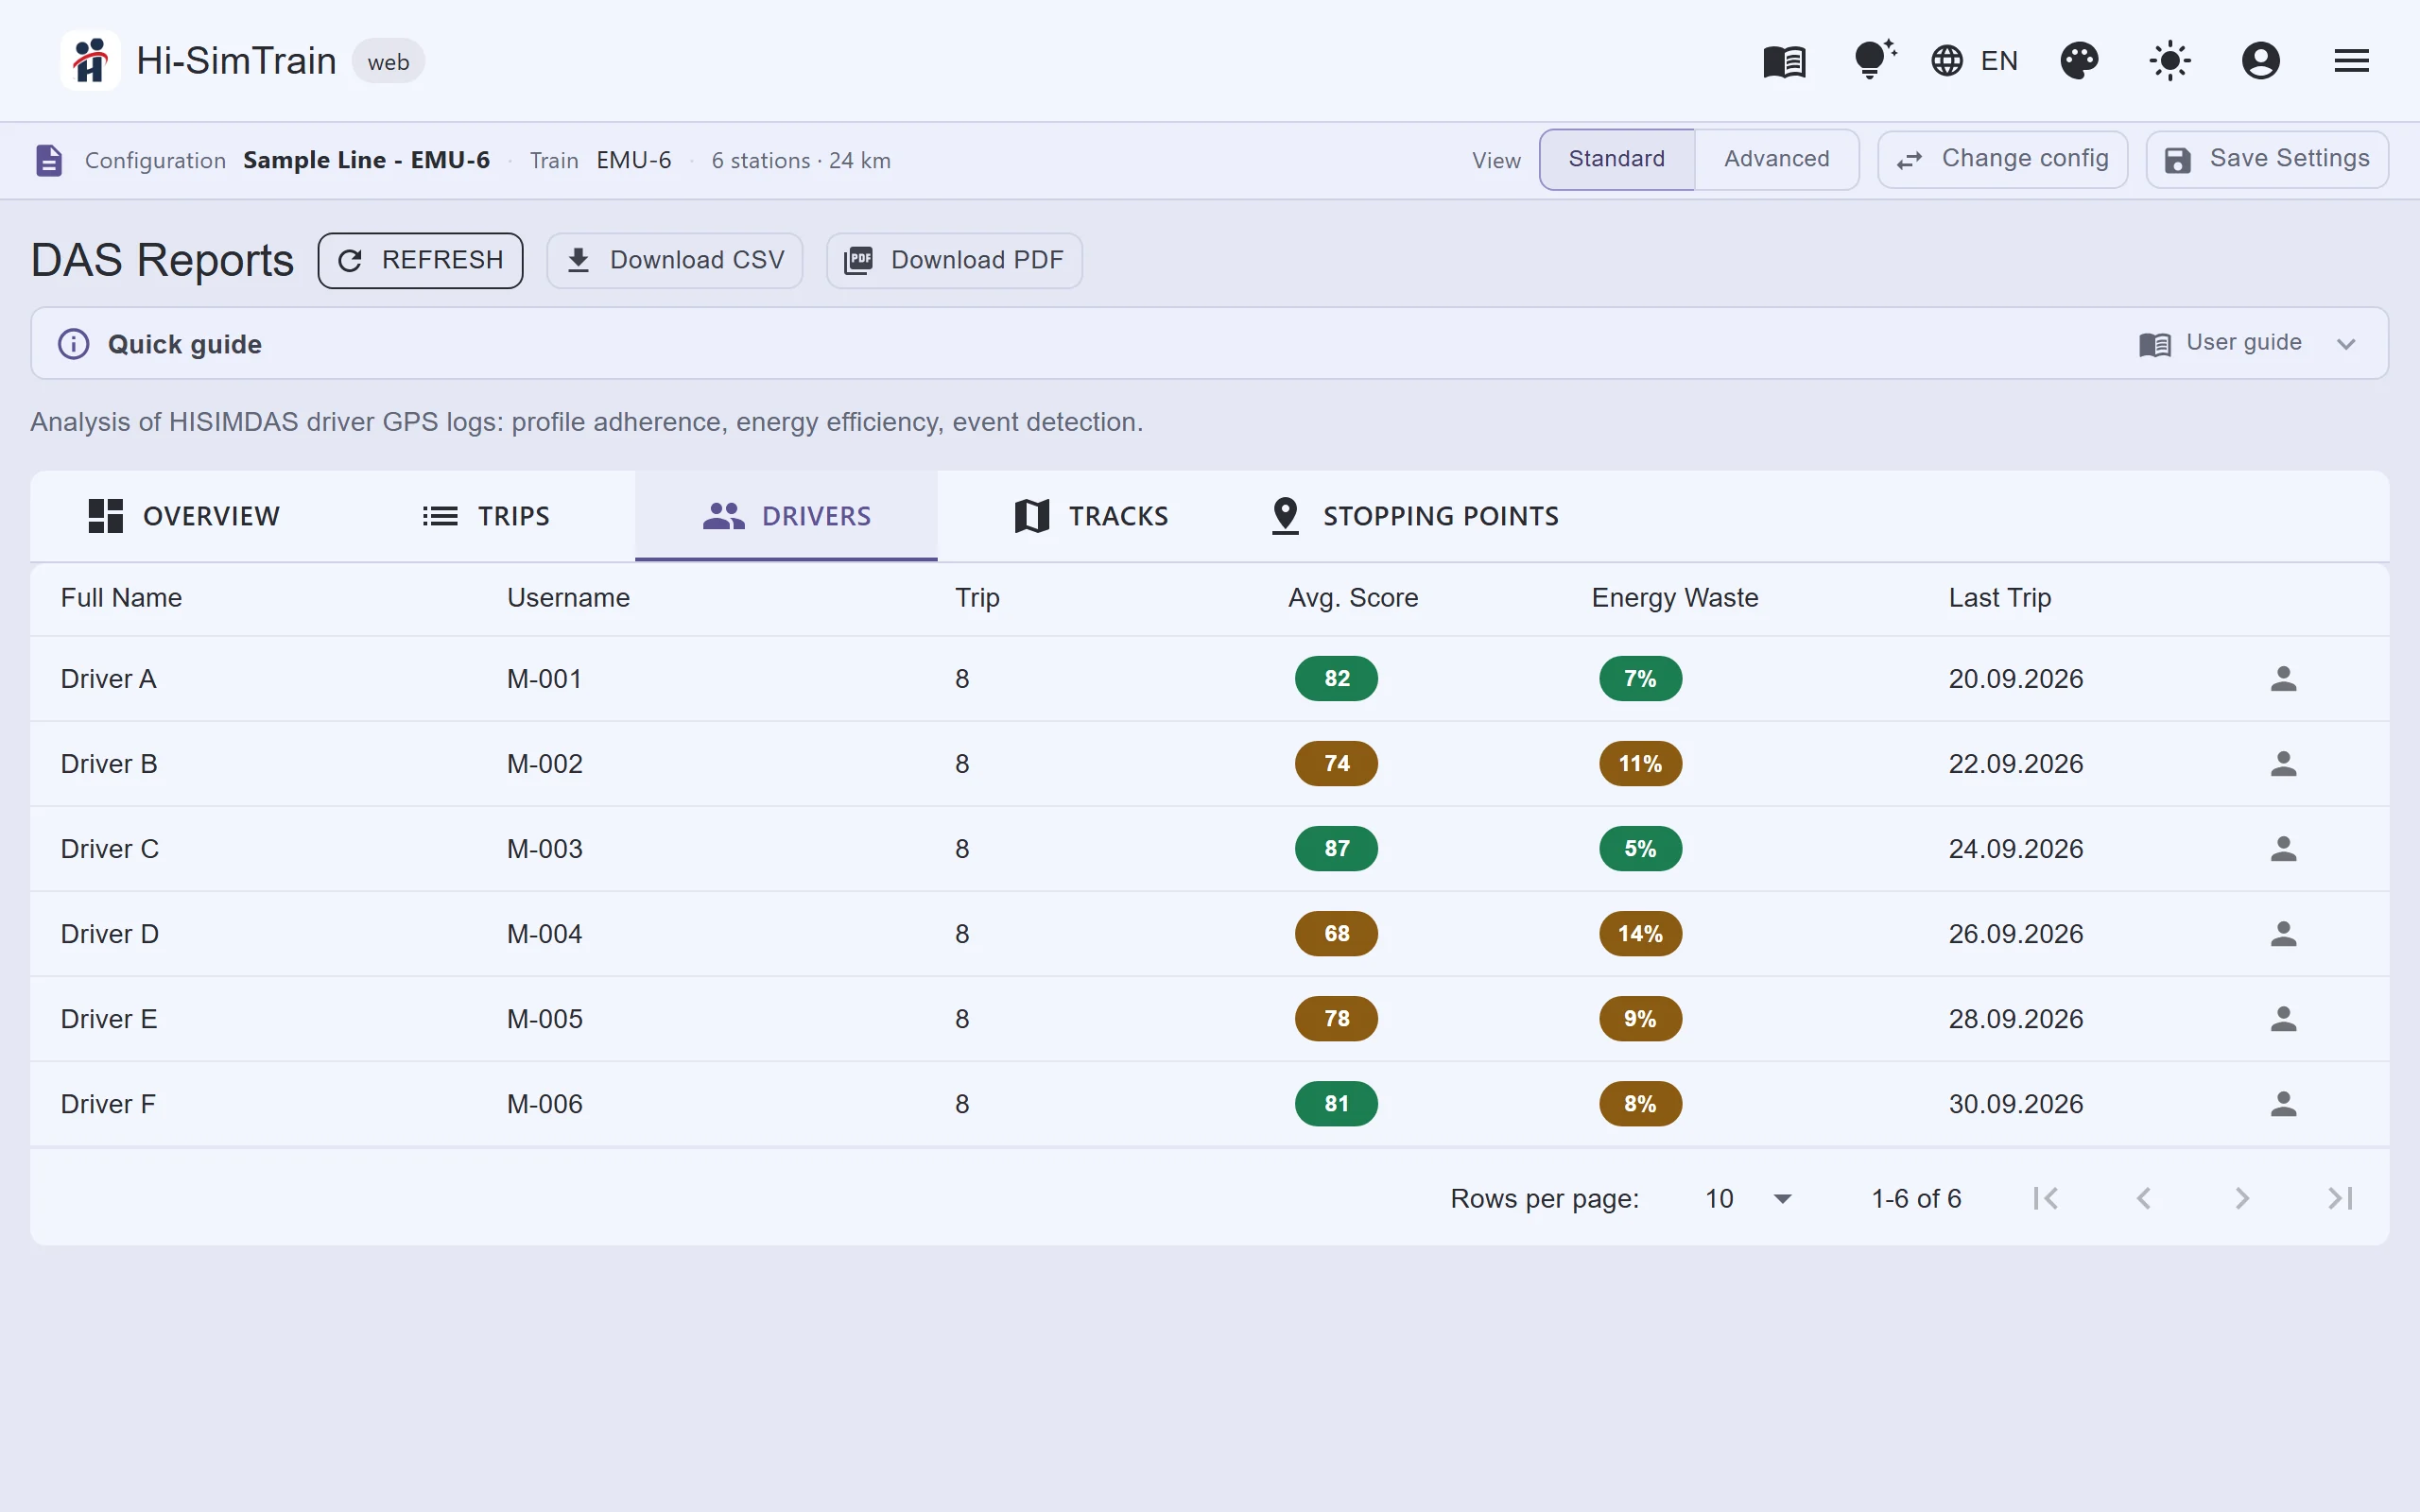
- Drivers and driver profile: Trip count, average score, average energy waste, total events, last trip; score trend and full trip history.
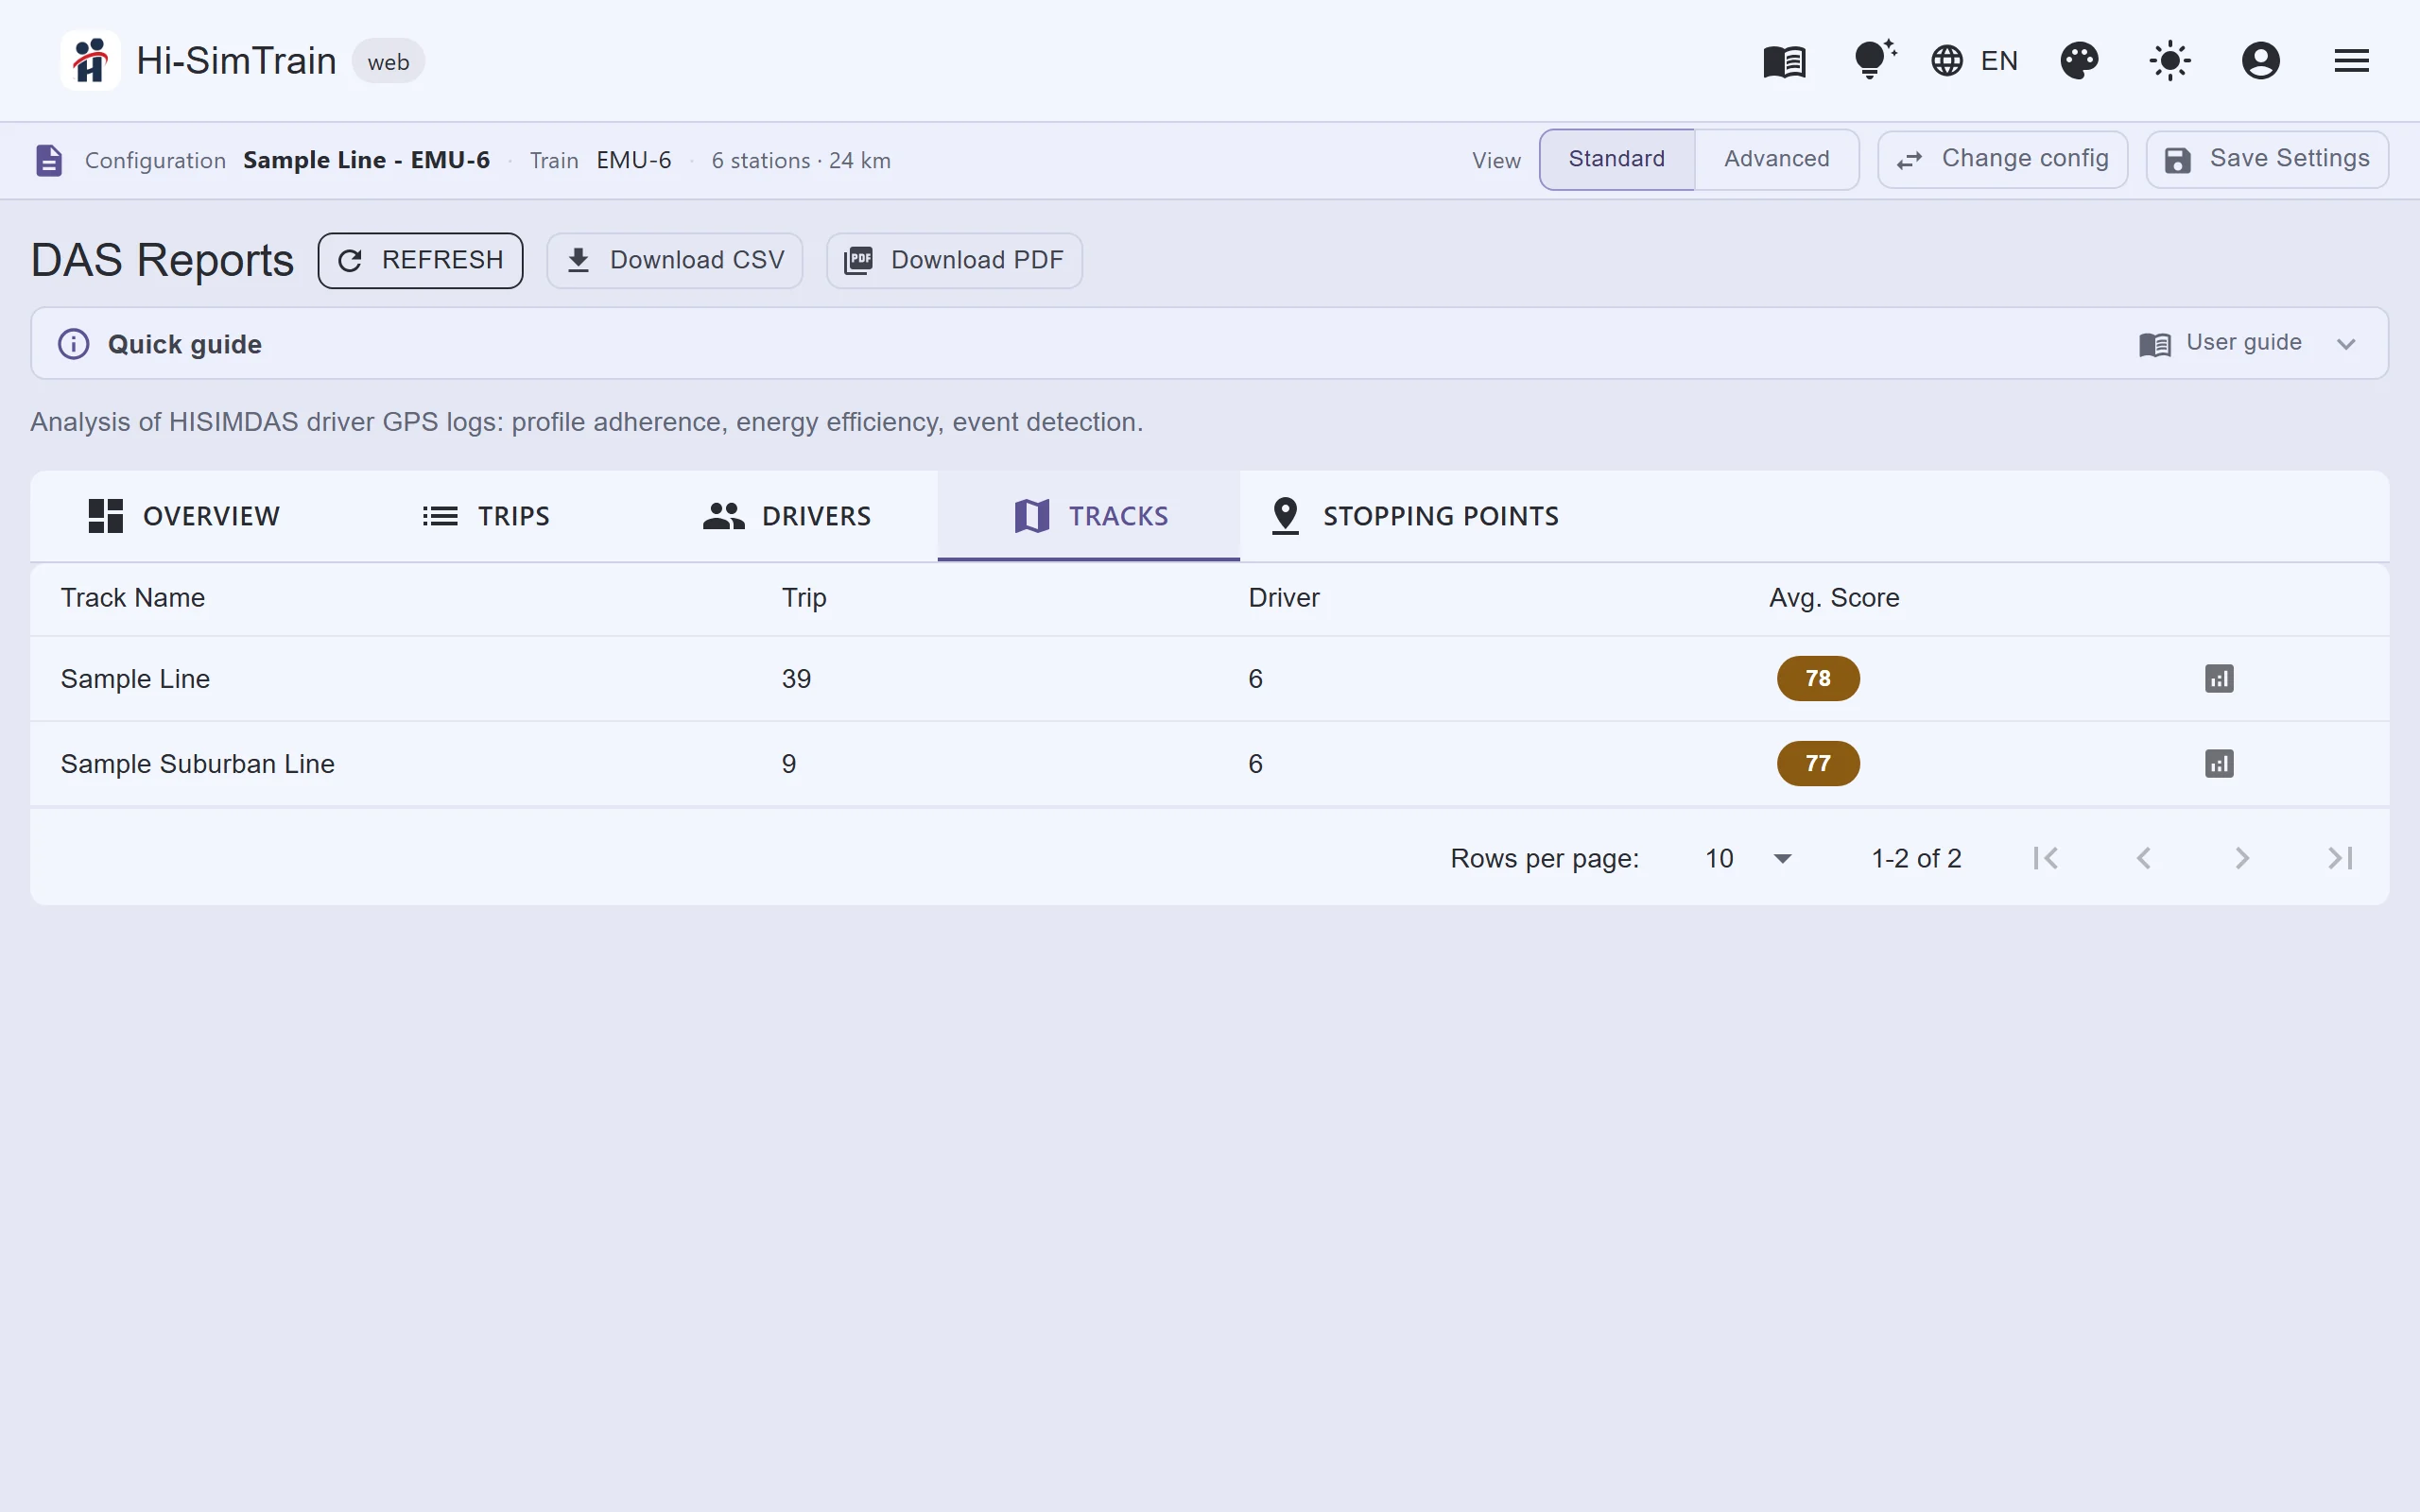
- Lines and line analysis: Trips and drivers per line, average score; driver ranking and event density by position.
- Stopping points: Station points captured by drivers in the field, their difference from the position in the line data, approval and change history.
Screens
Real Hi-SimTrain web screens with synthetic example data (sample line, Drivers A–F); not real operating data.
Reports
In the example data on these screens the average adherence score is 84.7.
Optimisation
The example on these screens: 18.7% energy saving; traction energy 11.5 → 8.8 kWh/km.
Track Builder
What can you do with it?
How do I drive this line with the least energy without missing the timetable, and how many kWh do I save?
Optimisation looks for the driving that uses the least energy without exceeding the timetable. The user sets the time budget; the system proposes coasting windows and, where useful, eco speed limits. Eco-driving optimisation →
Where should coasting start, and at what speed should it end?
Optimisation looks for the driving that uses the least energy without exceeding the timetable. The user sets the time budget; the system proposes coasting windows and, where useful, eco speed limits. Eco-driving optimisation →
What does a proportional speed limit reduction or an eco speed limit add to running time and energy?
Optimisation looks for the driving that uses the least energy without exceeding the timetable. The user sets the time budget; the system proposes coasting windows and, where useful, eco speed limits. Eco-driving optimisation →
How large is the difference between all-out and eco driving, station by station, and how do I present it to management?
Turns simulation results into a document for management and stakeholders. Eco-driving report →
How do I generate position, elevation and gradient data from a map for a line I have no data for?
Accurate simulation starts with accurate line data. Hi-SimTrain keeps line data in editable tables, generates new lines from map data and improves station positions with measurements from the field. Line data and Track Builder →
Do the gradients or station positions in my line data match the field?
Accurate simulation starts with accurate line data. Hi-SimTrain keeps line data in editable tables, generates new lines from map data and improves station positions with measurements from the field. Line data and Track Builder →
How closely do my drivers follow the advice; who does well, on which line, in which section?
Reports show whether the investment in eco-driving pays off in the field. Every trip is compared with the advice the driver saw in the cab and scored in the same way. On one screen the operator sees fleet adherence, energy and punctuality indicators, the driver ranking and where problems cluster along the line, and can drill down from any figure to the chart of a single trip. Reports →
Where is coasting missed most often, and in which stretch does harsh braking cluster?
Reports show whether the investment in eco-driving pays off in the field. Every trip is compared with the advice the driver saw in the cab and scored in the same way. On one screen the operator sees fleet adherence, energy and punctuality indicators, the driver ranking and where problems cluster along the line, and can drill down from any figure to the chart of a single trip. Reports →
Which trains are running right now, how fast, and how far from the next station?
Managers follow active trips in the field on a map in real time. Live tracking →
How do I change the settings of every tablet from one place, and which device has received the new settings?
HISIMDAS settings are managed centrally from the web, not device by device. Central management of the mobile app →
Who used which screen and when; how loaded is the server?
Shows who uses the platform, how, and how loaded the server is. Monitoring, records and sign-in history →
How do I limit a driver account to the mobile app only, and an admin to their own organisation?
An account and permission model built for several organisations. Users, organisations, roles and permissions →
FAQ
How do I access Hi-SimTrain?
The web application is at hisimtrain.com and is used with organisational accounts. The Turkish and English user guide is published at hisimtrain.com/kullanim-kilavuzu; there is also a Windows desktop edition.
How do Hi-SimTrain and HISIMDAS work together?
HISIMDAS gets track geometry, the driving profile and its settings from the Hi-SimTrain server and uploads trip logs to it. Coasting zones designed in Hi-SimTrain drive the app’s fixed mode, and uploaded trips feed the DAS reports.
Which target time does the optimization use?
The target can be the timetable minimum or natural time, or the all-out time plus a percentage; the default is 1.05 times the all-out time.
An eco-driving study for your line
Write to us to evaluate Hi-SimTrain and HISIMDAS with your own track and train data.
info@hisim.com.tr